Category: Stories

  • Next Week’s Moves: Laying the Groundwork for 2025

    Next Week’s Moves: Laying the Groundwork for 2025

    Last week closed with the S&P 500 failing to break out above the upper trend line or 608, showing weakness. These levels now serve as the two key resistance areas to watch into the end of the year.

    My X feed is full of posts outlining the weak fundamentals in the market right now:

    • Revisions to job numbers
    • Widening market breadth
    • Extreme P/E ratios

    As a contrarian, I’d prefer to see less bearish sentiment, but it might just be the algorithm zeroing in on me. I’ve also noticed the usual hype around Bitcoin and Nvidia, so we’ll see how it plays out heading into year-end.

    Rather than trying to predict whether the market will keep melting up or drop, let’s review the stocks I’m building positions in for 2025.

    Intel (INTC)

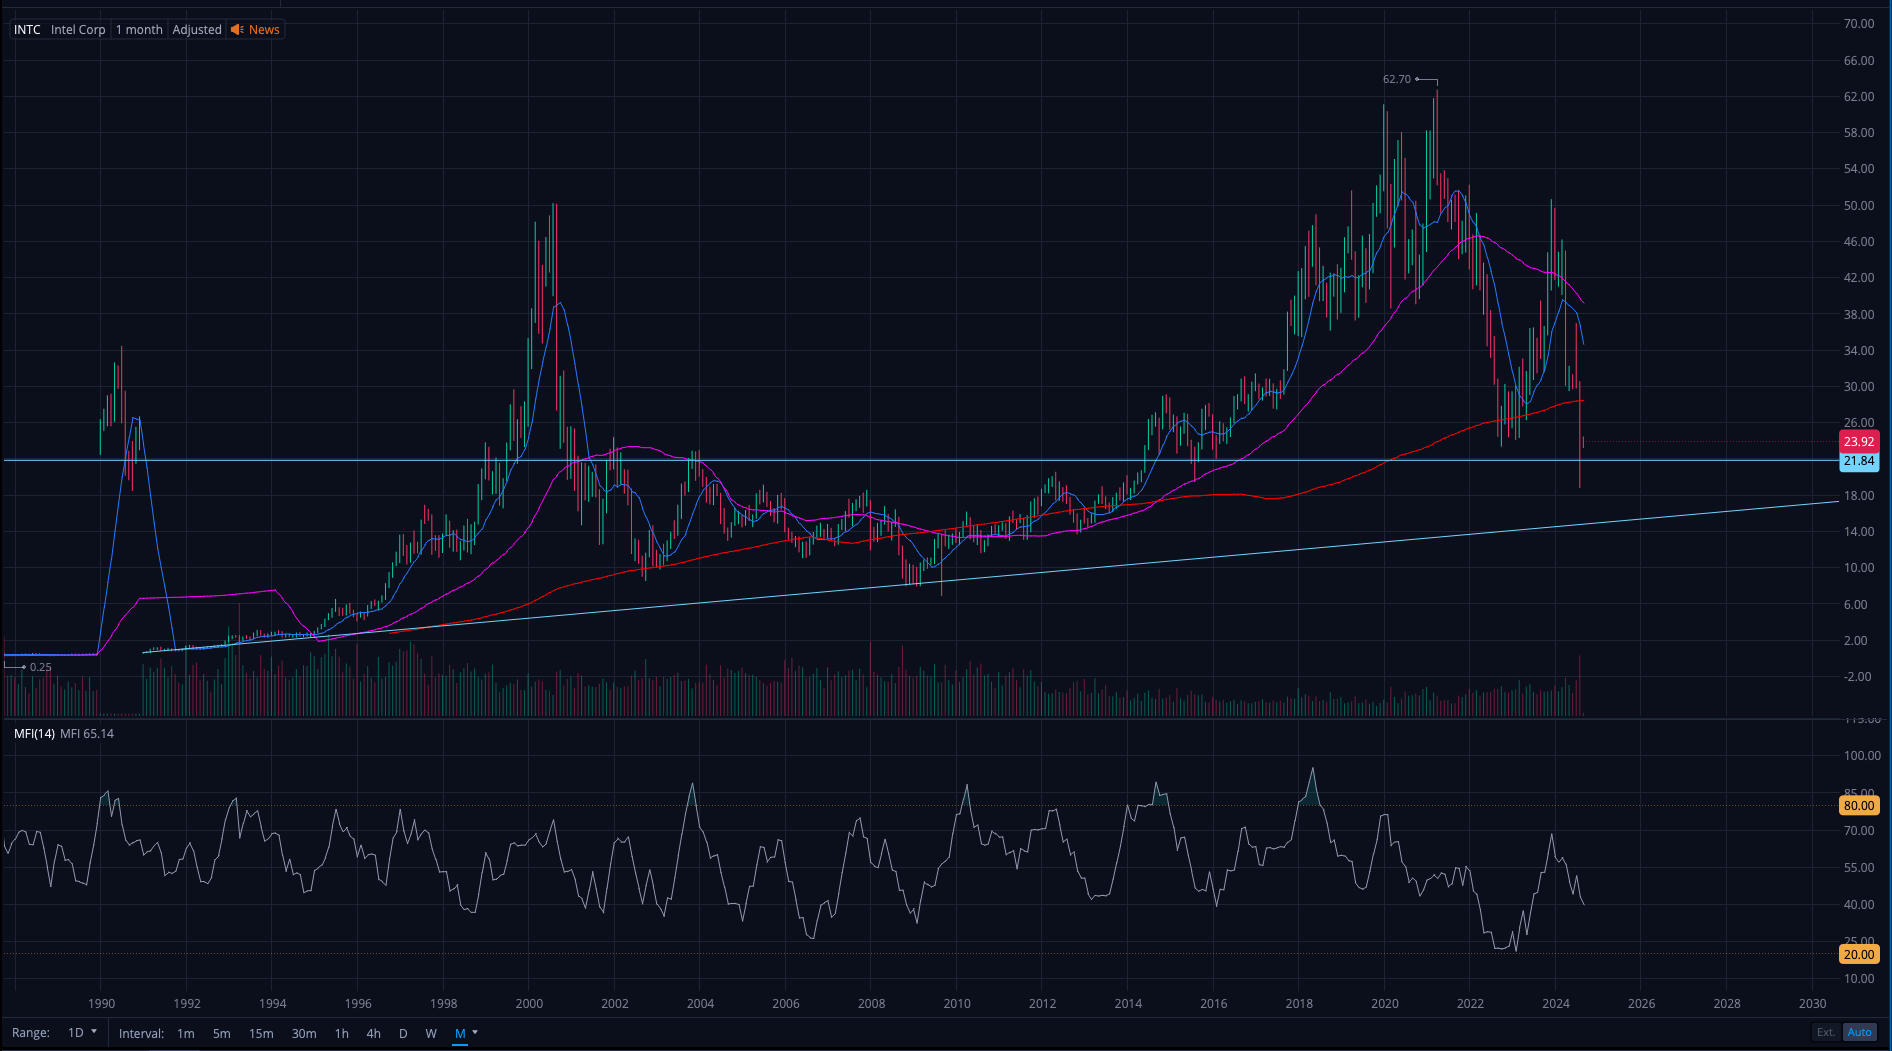
    Intel is struggling to hold the $20 support zone. If it doesn’t reclaim $24 soon, more downside seems likely.

    Reports suggest Intel may spin off its manufacturing division in the future, but neither Co-CEO has confirmed their plans. Personally, I see Intel’s strength in its manufacturing capabilities, so I view this as positive news. However, the impact on the stock price and share structure remains uncertain.

    Intel also continues searching for a permanent CEO, which likely limits investor confidence in the short term.

    Advanced Micro Devices (AMD)

    I haven’t started accumulating AMD shares yet, but the current stock price has caught my attention.

    AMD gained some traction from the AI buzz surrounding Nvidia in 2023 but lost favor earlier this year. Trading near $125, AMD has retested a key breakout level from December 2023 — something Nvidia hasn’t done yet. If selling slows in the next month, I may start building a position as close to $125 as possible.

    That said, I need to dig deeper into AMD’s fundamentals and evaluate how it plans to position itself as a competitor in the AI space. In my recent article on Warren Buffett’s investing psychology, I emphasized the importance of understanding a business instead of just buying a stock because it looks cheap.

    Occidental Petroleum (OXY)

    OXY continues trading near support with little indication of a bounce. If selling persists, the next support level could be around $42.

    Despite OXY’s struggles, crude futures remain strong. Since OXY’s performance ties closely to oil prices, a rebound in crude could strengthen the stock. For now, I’m staying patient.

    Boeing (BA)

    Boeing has been one of my best investments this year, rising 22% since my mid-November entry. However, the daily Money Flow Index (MFI) indicates overbought conditions, and the stock is approaching a gap fill from late August.

    To free up cash for other opportunities, I began selling my position last week and plan to exit completely by tomorrow. Boeing’s long-term prospects still look solid, but I’m taking profits after this strong rally.

  • Invest Like Warren Buffett

    Invest Like Warren Buffett

    No investor’s education is complete without understanding the legacy of Warren Buffett. Known as one of the greatest investors of all time, Buffett’s track record speaks for itself. In 1965, he gained control of Berkshire Hathaway, a struggling textile company, for around $15 per share. Since then, he’s transformed it into a massive conglomerate, now trading near $700,000 per share. Since Buffett’s takeover, an investment in Berkshire has grown at nearly double the rate of the S&P 500, delivering returns over 140 times those of the index.

    While there is much to learn from Berkshire’s fundamentals and 60 years of growth, this article focuses on the psychology behind Buffett’s investment strategies. My goal is to help you think like Buffett and improve your own investing — not to persuade you to buy shares of Berkshire Hathaway. Let’s explore the principles and practices of Buffett’s investing.

    Focus on the business behind the stock

    Early in his career, Buffett invested in low-cost companies regardless of their underlying fundamentals. While his early investments paid off, he learned it was better to focus on companies with strong fundamentals, even if they cost more. He is famously quoted as saying, “It’s far better to buy a wonderful company at a fair price than a fair company at a wonderful price.”

    To be fair, Berkshire has the resources to acquire entire companies—and often does. While lay investors like us won’t make purchases on that scale, we can adopt the same mentality.

    Here are three principles to help you put this mindset into practice:

    1. Research and learn how to value companies

    Buffett emphasizes the importance of investing like you’re buying the whole business. This means evaluating the company’s cash flow, product range, market position, and future potential.

    Let’s be clear: thorough research takes time. It might be tempting to rely on social media or your favorite analysts for quick answers, but blindly following can be risky. If you can’t commit to understanding your investments, you’re better off sticking with an index fund.

    The financial industry is full of mediocre personalities who can’t help when they’re wrong. If you’re trying to be your own financial advisor, you need to know the company you’re investing in through and through.

    2. Think rationally and avoid emotional trades

    Because Buffett’s strategy involves finding excellent companies at a fair price, he often misses out on big moves when he disagrees with the market’s valuation. A company’s popularity doesn’t make it a wise investment.

    The stock market reflect expectations about the future rather than current realities, making the market speculative and unpredictable. Many companies rally on speculation or news, only to lose that growth later. Don’t let emotions or fear of missing out trap you in a bad investment.

    3. Learn when to hold and when to let go

    Buffett is often associated with a buy-and-hold-forever approach, but this doesn’t mean he always keeps his investments forever. For example:

    • IBM: Held from 2011 to 2018. Buffett sold all shares after the company failed to adapt to new competition in the industry.
    • Airlines: Held from 2016 to 2020. The Covid pandemic disrupted the travel industry, leading Buffett to exit all airline stocks by April 2020.
    • Wells Fargo: Held from 1989 to 2022. Buffett sold his position entirely due to a loss of confidence in the bank’s leadership following its fraudulent accounts scandal.

    In short, Buffett’s investment confidence comes from the company, not the stock price. If the underlying fundamentals change, it may be wise to reevaluate your position and make necessary adjustments.

    Practice patience and trust the process

    You may have heard one of Buffett’s famous quotes, “The stock market is a device for transferring money from the impatient to the patient.” This sentiment is often echoed in investing circles, but retail investors rarely follow it. The stock market can help you build sustainable, lasting wealth — but only with the right approach.

    Covid fears in 2020 triggered a market-wide crash, with sectors like oil and transportation taking the hardest hits. Meanwhile, niche stocks such as Zoom and Peloton soared during the post-Covid recovery, and meme stocks like GameStop and AMC gained massive followings on social media.

    As the dust settled, the market began to self-correct. Pandemic favorites tumbled from their inflated valuations while strong companies regained stability. Indices — especially those heavily weighted in tech — have all but erased any sign that the US entered a recession in 2020.

    Continue learning how to invest wisely

    Buffett bought his first stock at the age of 11, setting him on the path of investing. He earned a Bachelor of Science in Business Administration from the University of Nebraska and a Master’s degree in Economics from Columbia University. At Columbia, he studied under Benjamin Graham, who became his mentor and introduced him to the principles of value investing.

    Buffett valued education from an early age, and today’s investors have unprecedented access to information. With vast libraries of educational materials at our fingertips, we have resources that past generations of investors could only imagine. We should not let it go to waste.

    Reading books, analyzing financial reports, listening to podcasts, and watching videos are great ways to expand your knowledge and make informed decisions. However, it’s important to be cautious if you’re learning from social media personalities. I find that the most successful investors often base their strategies on lessons from the past rather than fleeting fads.

    Understand Buffett’s aversion to risk

    It’s important to understand Buffett’s current position and how it differs from the ordinary investor. In Berkshire’s most recent letter to shareholders, Buffett wrote:

    “Extreme fiscal conservatism is a corporate pledge we make to those who have joined us in ownership of Berkshire. In most years – indeed in most decades – our caution will likely prove to be unneeded behavior – akin to an insurance policy on a fortress-like building thought to be fireproof. But Berkshire does not want to inflict permanent financial damage… Berkshire is built to last.”

    Simply put, Buffett’s priority is now to the shareholders. He’s already built his wealth and now he needs to preserve it. To achieve meaningful performance, Berkshire would need to acquire substantial stakes or entire companies, but Buffett doesn’t see many opportunities out there.

    Buffett’s aversion to speculative assets like Bitcoin and surging AI stocks like Nvidia should remind us to prioritize sustainable, value-driven investments over short-term speculation.

  • The Rally That Keeps Defying Gravity

    The Rally That Keeps Defying Gravity

    Despite an extraordinary run in 2024, the S&P 500 continues to make new all-time highs. The U.S. stock market is displaying a fresh wave of optimism among investors, even amidst economic uncertainty, global volatility, and recessions in other parts of the world.

    Chasing winners

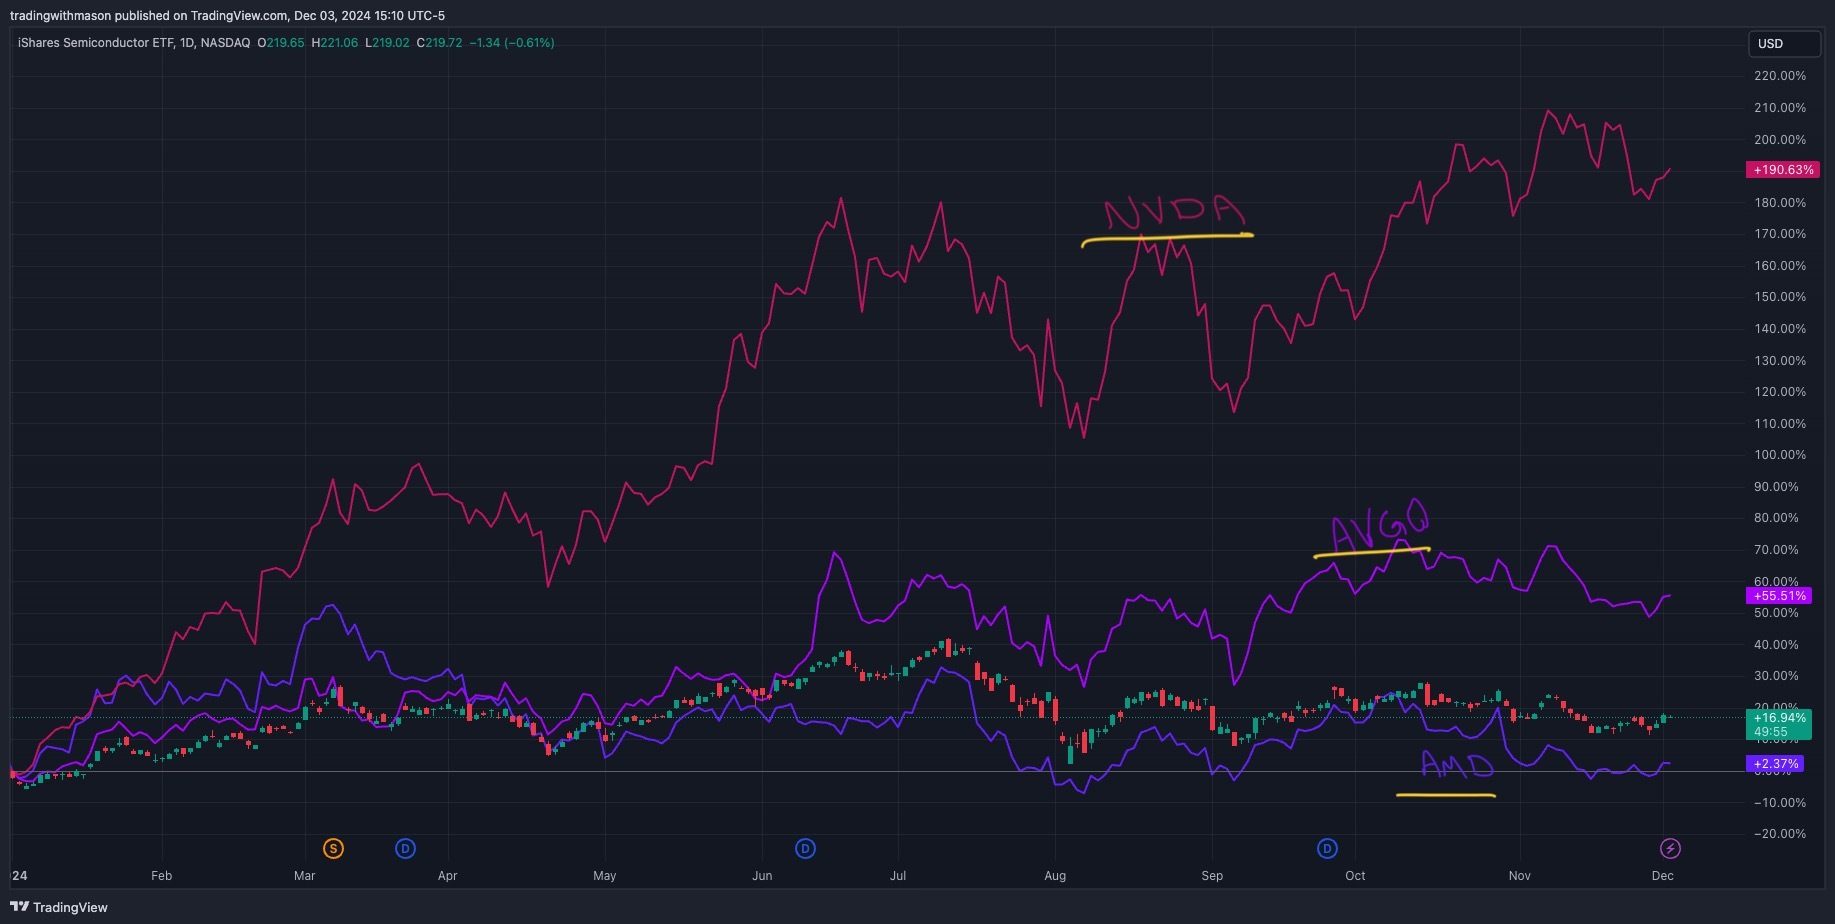
    This optimism, while remarkable, seems to be focused on a select group of equities. Consider the iShares Semiconductor ETF (SOXX) compared to its top three holdings:

    1. Nvidia (NVDA)
    2. Broadcom (AVGO)
    3. Advanced Micro Devices (AMD)


    The chart demonstrates that investors are flocking to Nvidia, likely driven by enthusiasm surrounding AI and the company’s dominant market position.

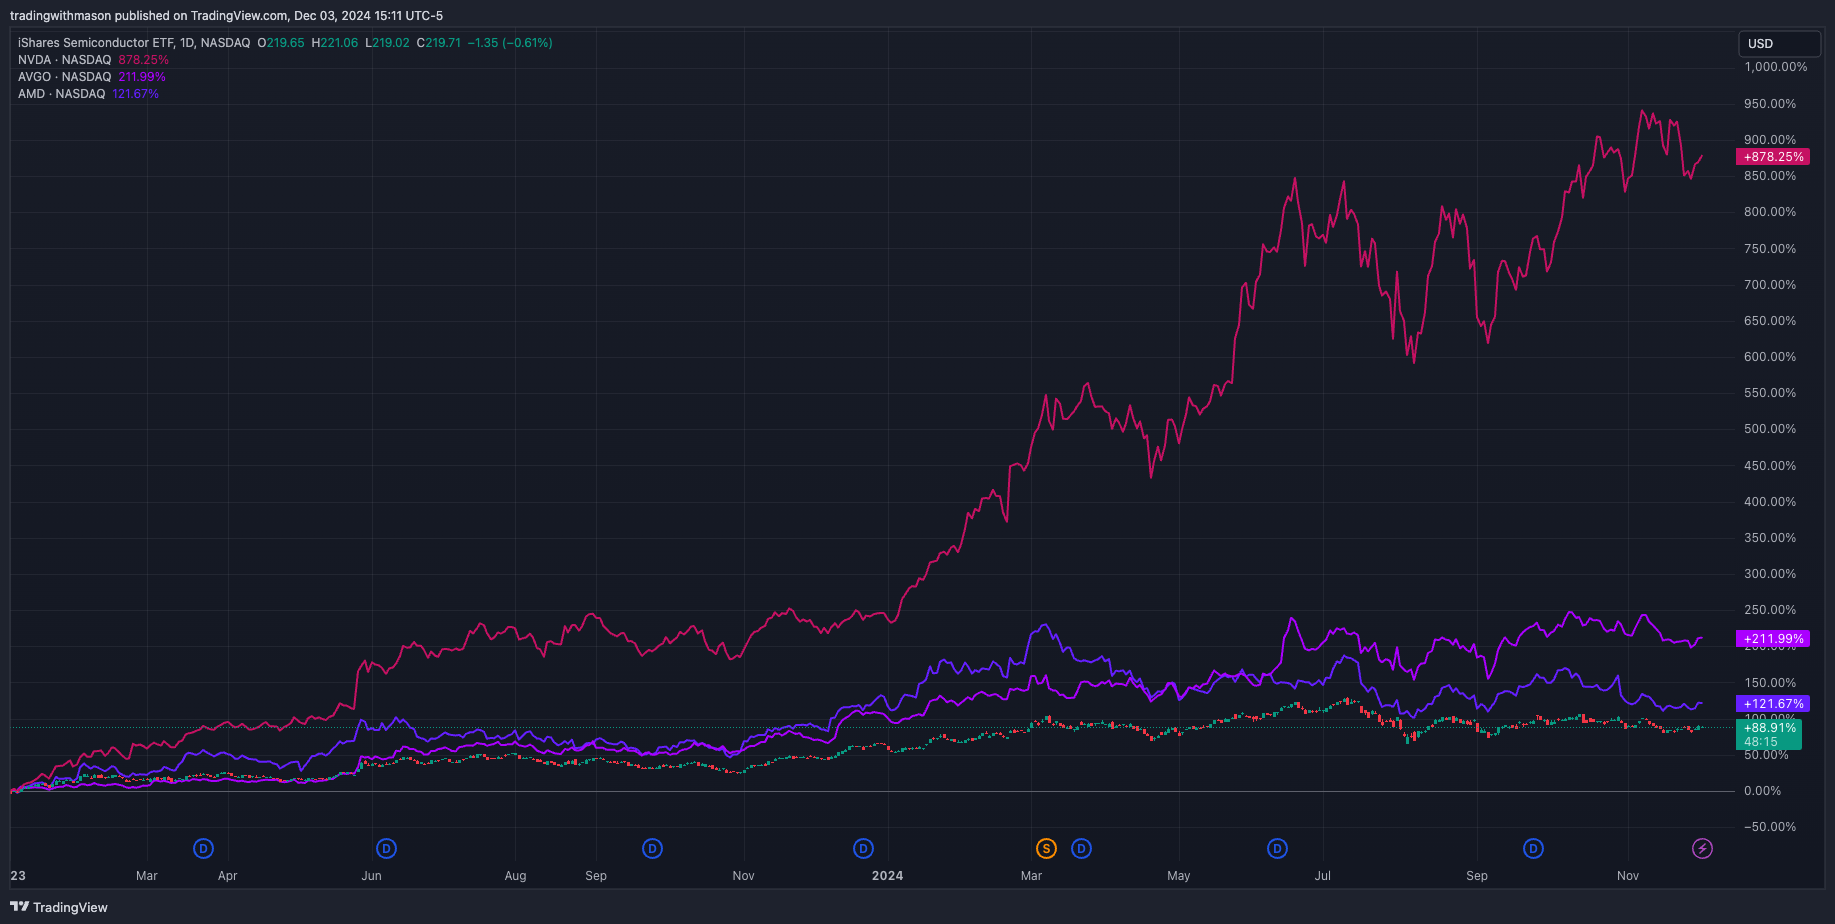
    The divergence becomes even more pronounced when we examine data going back to 2023.

    Breaking it down

    A degree of favoritism from investors is normal. People tend to invest in companies they’ve heard about through news, social media, or recommendations from their social circles. This creates a feeling of safety in purchasing stock from a well-known company. As optimism builds, it often becomes self-fulfilling as momentum drives further buying.

    However, the current divergence is pushing boundaries. If everyone piles into a single company, at what point does it become overvalued? The AI sector, though booming, is still new. Analysts are struggling to forecast growth accurately, which is a similar problem in the cryptocurrency industry.

    Take Bitcoin, for example. A recent post I came across on X said:

    CAGR refers to the compound annual growth rate, and 30% is exceptionally high. For context, the historical CAGR of the S&P 500 is about 10% (not adjusted for inflation). Assuming Bitcoin will sustain a 30% CAGR for decades is bold. The reality is that there isn’t enough historical data to justify such a strong forecast. Still, many crypto enthusiasts believe 30% is relatively mild for its growth.

    A while ago, an investor friend told me about his “Babbling Brook Theory.” Imagine a leaf falling into a brook. It’s easy to predict where the leaf might be a foot downstream, but as it drifts further, the currents and obstacles make its path more complex. It’s the same with the stock market.

    Lessons from history

    Historical data may offer clues about what’s next for the market.

    2019

    From January to December 2019, the S&P 500 returned over 30%. However, when Covid fears hit in early 2020, those gains (and then some) were erased. The market rebounded thanks to stimulus and quantitative easing by the Federal Reserve, with the S&P 500 returning another 18% between December 2019 and December 2020.

    The years after saw impressive gains, except for a dip in 2022. This raises the question: Could the market once again shrug off economic fears and continue its rally?

    2013

    In 2013, the S&P 500 also returned over 30%. Unlike the rapid rebound of 2020, the index stagnated for a few years. From 2014 to 2016, it repeatedly returned to December 2013 levels before finally breaking higher in 2017.

    If 2025 follows a similar path, the market could be entering a period of stagnation where gains are harder to lock in.

    Breaking it down

    These scenarios illustrate two potential paths forward: an extended rally supported by a select group of sectors or a slower, more uncertain climb marked by consolidation and stagnant returns.

    It’s also possible that the current divergence could begin to even out, with growth in the largest companies slowing and smaller, under-the-radar companies attracting fresh inflows. Such a rebalancing could uncover opportunities in areas that have been largely overlooked by investors during the current rally.

    Where the market goes from here is anyone’s guess. This uncertainty highlights the importance of making intentional, well-informed investment decisions rather than letting emotions dictate your choices.

    Stocks on my radar

    The biggest names in the market right now are trading at valuations that I find extreme and unappealing. However, there are several strong companies flying under the radar, trading at what I consider a discount if the market were to stabilize.

    Intel (INTC)

    Intel has struggled in recent years due to mismanagement and its absence from the AI boom. In response, the company appears to be shifting its focus from innovation to manufacturing within the semiconductor space. This shift may provide the foundation Intel needs to reverse its downward trajectory and rebuild investor confidence in the years ahead.

    Occidental Petroleum (OXY)

    Occidental has the strong backing of Warren Buffett’s Berkshire Hathaway, which owns nearly 30% of the company. Its position in the energy sector, combined with solid financials, makes it an intriguing opportunity despite its underwhelming recent performance.

    Boeing (BA)

    Boeing’s dominance in the aerospace industry makes its current stock price particularly attractive. The demand for both commercial and defense aircraft remains steady, and once its recent controversies fade, the company is well-positioned for a recovery.

  • November Update

    November Update

    This year has been frustrating for my trading. I started significantly down on every position — mostly AI and index short positions. As we moved into summer, I cut losses and reevaluated my strategy. Like many traders, I found it difficult to make money as a bear.

    The market — at least since 2008 — is skewed toward the upside with inflation and media sentiment. With the exception of 2000 and 2008, the last two decades have been marked by extreme growth driven by perpetual inflation and loose economic policy.

    While I’d love to be optimistic about the U.S. economy going forward, there doesn’t seem to be much reason to be. Plenty of narratives point to strong growth ahead, but the slightest examination of underlying data suggests these are fictional stories attempting to lull the public into a false sense of security. Let’s look at some examples.

    “The American consumer is strong.”

    Job growth

    Before Biden dropped out of the presidential race, his campaign ads boasted that his administration created more than 15 million new jobs. While this number is somewhat true, 72% of the growth actually came from “recovered” jobs rather than “created” jobs. These recovered jobs were lost during the pandemic.

    Wages

    Wages are also down since 2021 when adjusted for inflation. If we look at the number prior to Covid, wages have kept up with inflation, but only barely. It also depends if inflation is calculated with the Consumer Price Index (CPI), which has a mixed reputation, or some other index. Here’s a full list of what’s included in CPI.

    Personal savings

    Prior to the pandemic, the Personal Savings Rate (personal savings as a percentage of disposable income) was increasing. In January 2017, the Personal Savings Rate was 5.3% and grew to 7.5% in February 2020. After the rapid rise from pandemic stimulus and subsequent crash, personal savings seems to be topping out around 5%.

    Of course, this can always change. But personal savings remained above 5% moving out of the 2000 and 2008 recessions. Now, it seems stuck below that level.

    Revolving debt

    Consumer loans like credit cards have been steadily rising since 2000, but they’re up 45% since mid-2021 and up 25% since pre-COVID levels. While some economists argue increasing debt is normal and even beneficial to economic growth, there is a fine line. When consumers are unable to pay back this debt, the short-term boost ends. Consumer delinquencies are also on the rise — a bad combination.

    “Inflation is down.”

    Earlier this year, the White House published a blog post titled, “Both Sides of the Ledger: Wage Growth Beating Price Growth Now For 15 Months in a Row.” But the authors used nominal growth instead of adjusting it for inflation which misrepresents the data.

    Here’s an example. A teacher made $40,000 in 2019 but makes $48,000 today. That represents nominal wage growth of 20%. Sounds good right?

    Using the CPI inflation calculator from the Bureau of Labor Statistics, purchasing power has decreased by 20% since 2019. Adjusted for inflation, that teacher’s salary hasn’t increased at all.

    That buying power is likely never coming back, and until wage growth overtakes inflation, middle and lower-class Americans will continue to hurt.

    “This is the most resilient market ever.”

    This one is true as of now, but I believe there has to be a reversion at some point. Perhaps the most convincing piece of a bear-case scenario is the widening market breadth that we’re currently seeing.

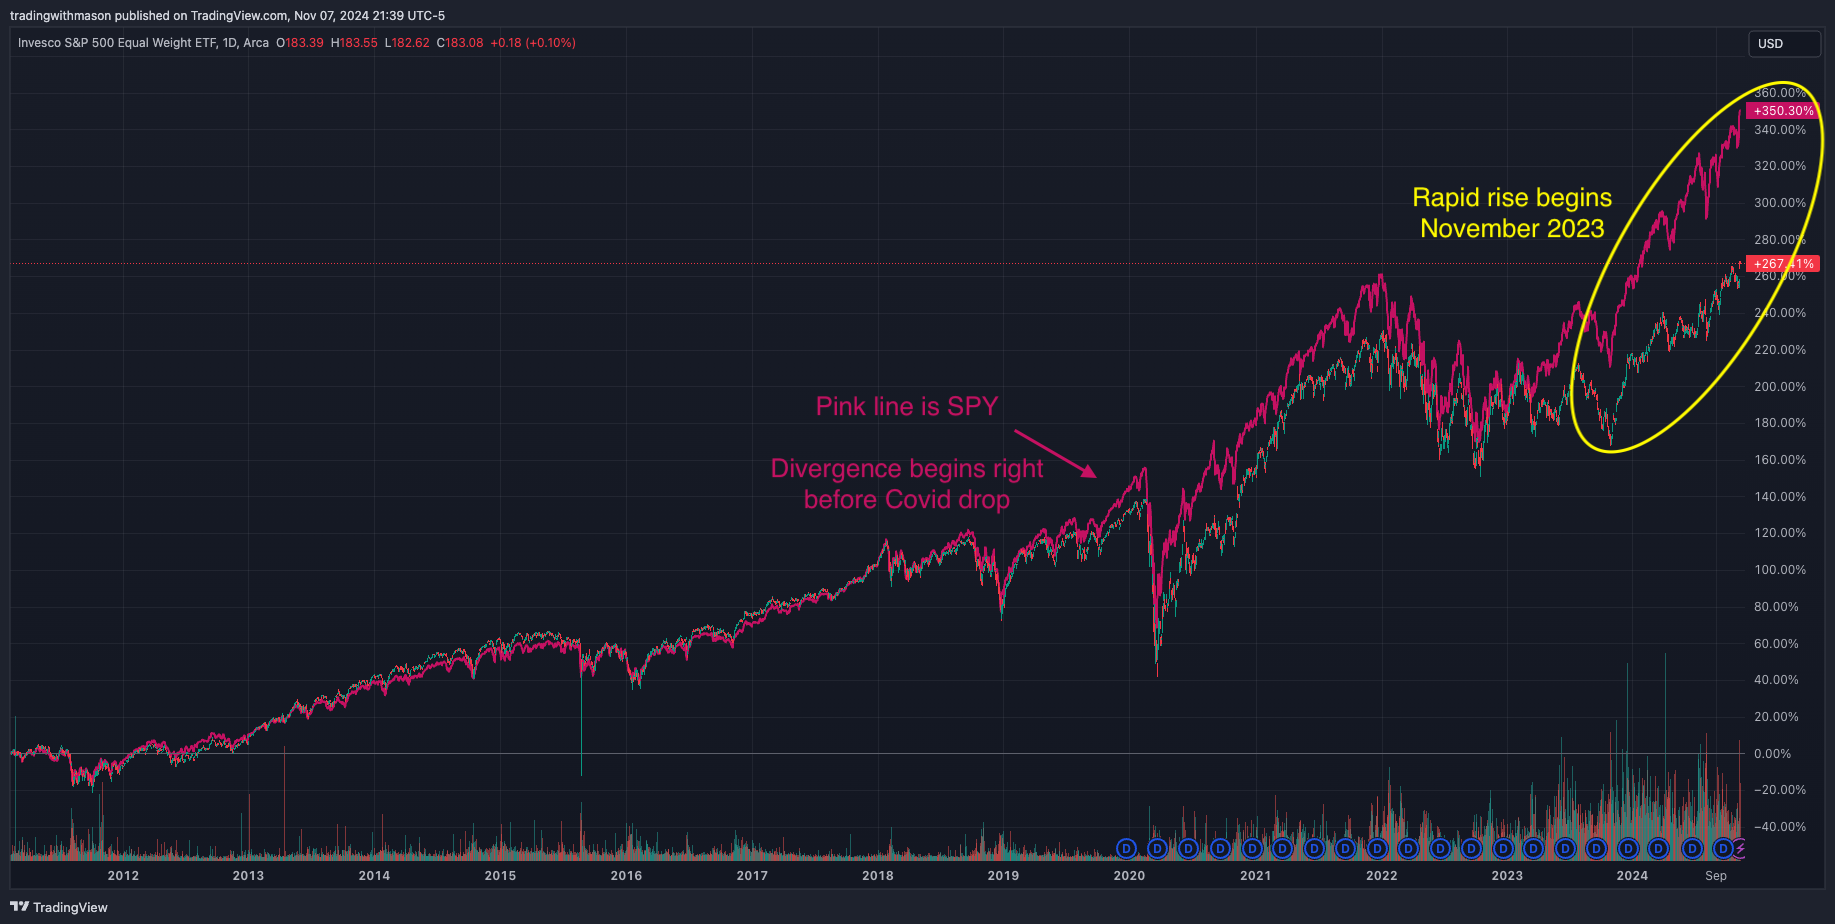
    I only became familiar with the stock market in 2020, so my personal experience is still limited. However, I spend a lot of time analyzing historical trends and evaluating how the market reacts during specific situations. Let’s compare SPY to RSP, the equal-weighted S&P 500 ETF.

    Looking back to 2011, RSP and SPY performed similarly until right before March 2020. After that, SPY has significantly outperformed its equal-weight counterpart, even though RSP has outperformed SPY since its inception in 2003.
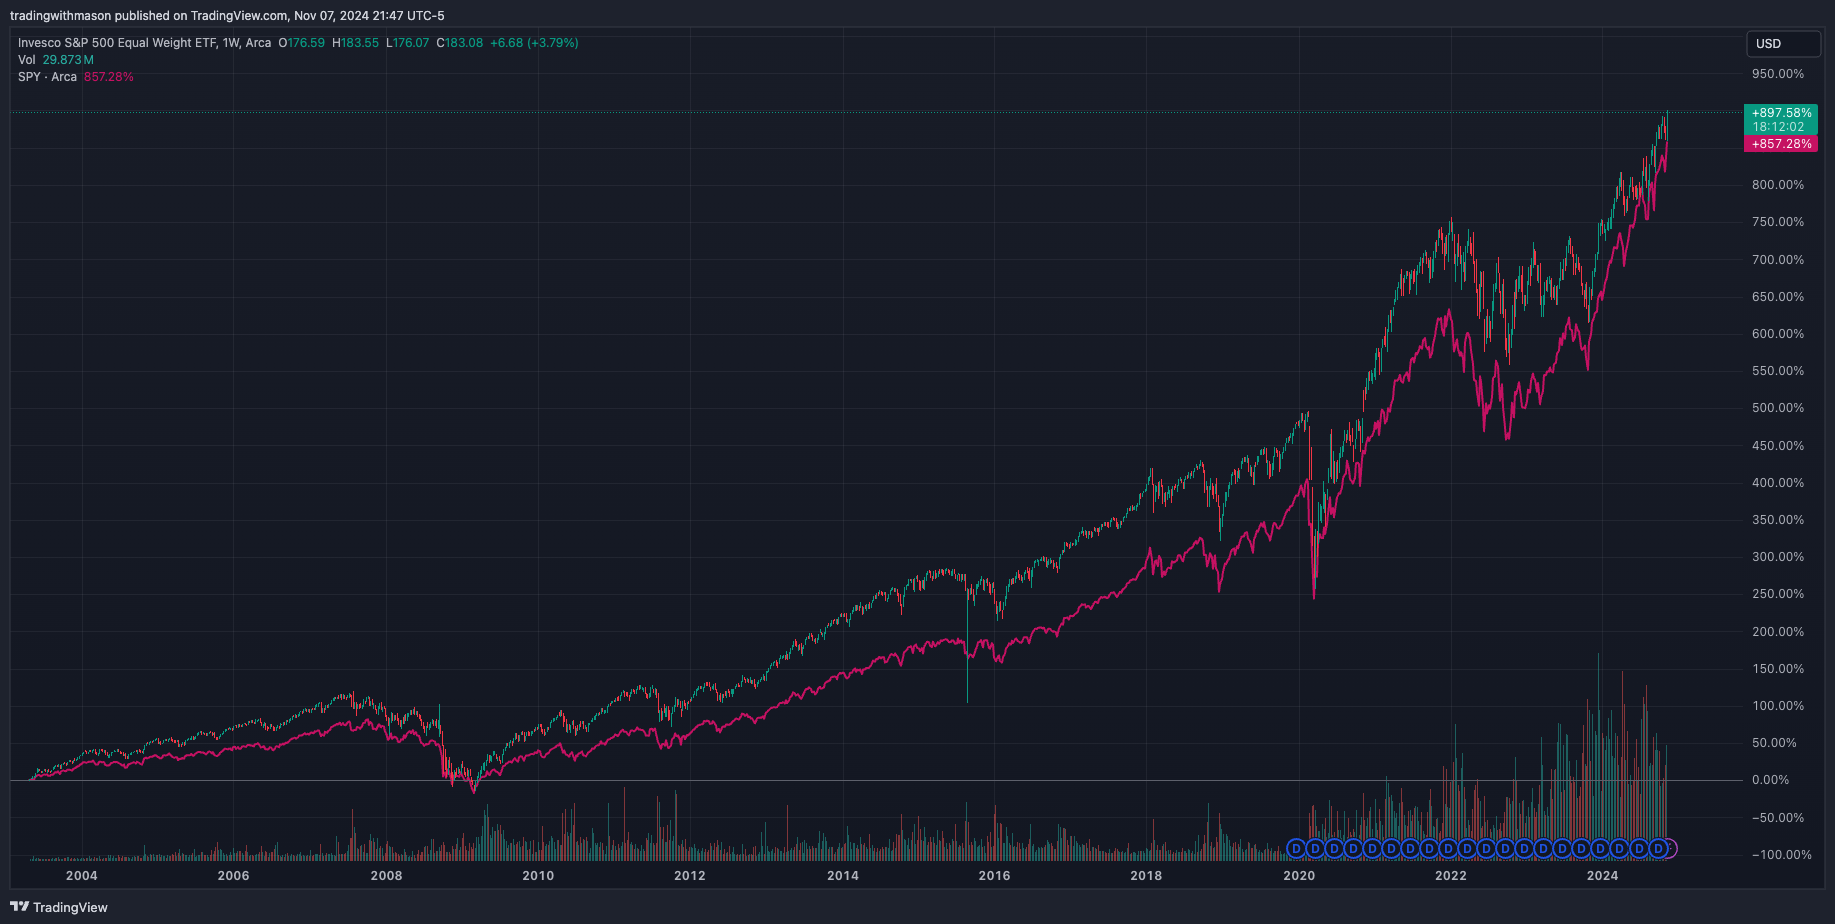
    The chart going back to 2003 shows that RSP has been a better investment if you bought in right at the beginning. But now SPY seems to be catching up for the first time in a bull market.

    Many claim the market we’re currently in is a “new normal.” My personal opinion, analyzing historical trends, is that this is never the case. There is always a reversion.

    Why does this matter?

    Personally, I am not adding any long-term stocks to my portfolio except for a select few underperforming companies. Stock prices and valuations are both just too high without hardly any price discovery.

    That said, my goal is not to tell you what to do. I simply want to provide quality information in a digestible format, so you don’t have to spend hours researching yourself. If you are dollar-cost averaging into the S&P or buy and hold for multiple years it probably doesn’t matter if the market falls. I just want to make sure people aren’t lied to about the strength of the economy right now.

    With that, I hope all have a great week ahead. I am excited to introduce this longer briefing format and would love feedback as well!

  • SPY: One Last Attempt at All-Time Highs?

    SPY: One Last Attempt at All-Time Highs?

    The market looks to be topping out with the potential for one more big move (if it ends up coming to fruition). Some of the poor performers are starting to get some buyers, but it’s not enough to coincide with another broad-market rally.

    Laggards: PayPal and Intel

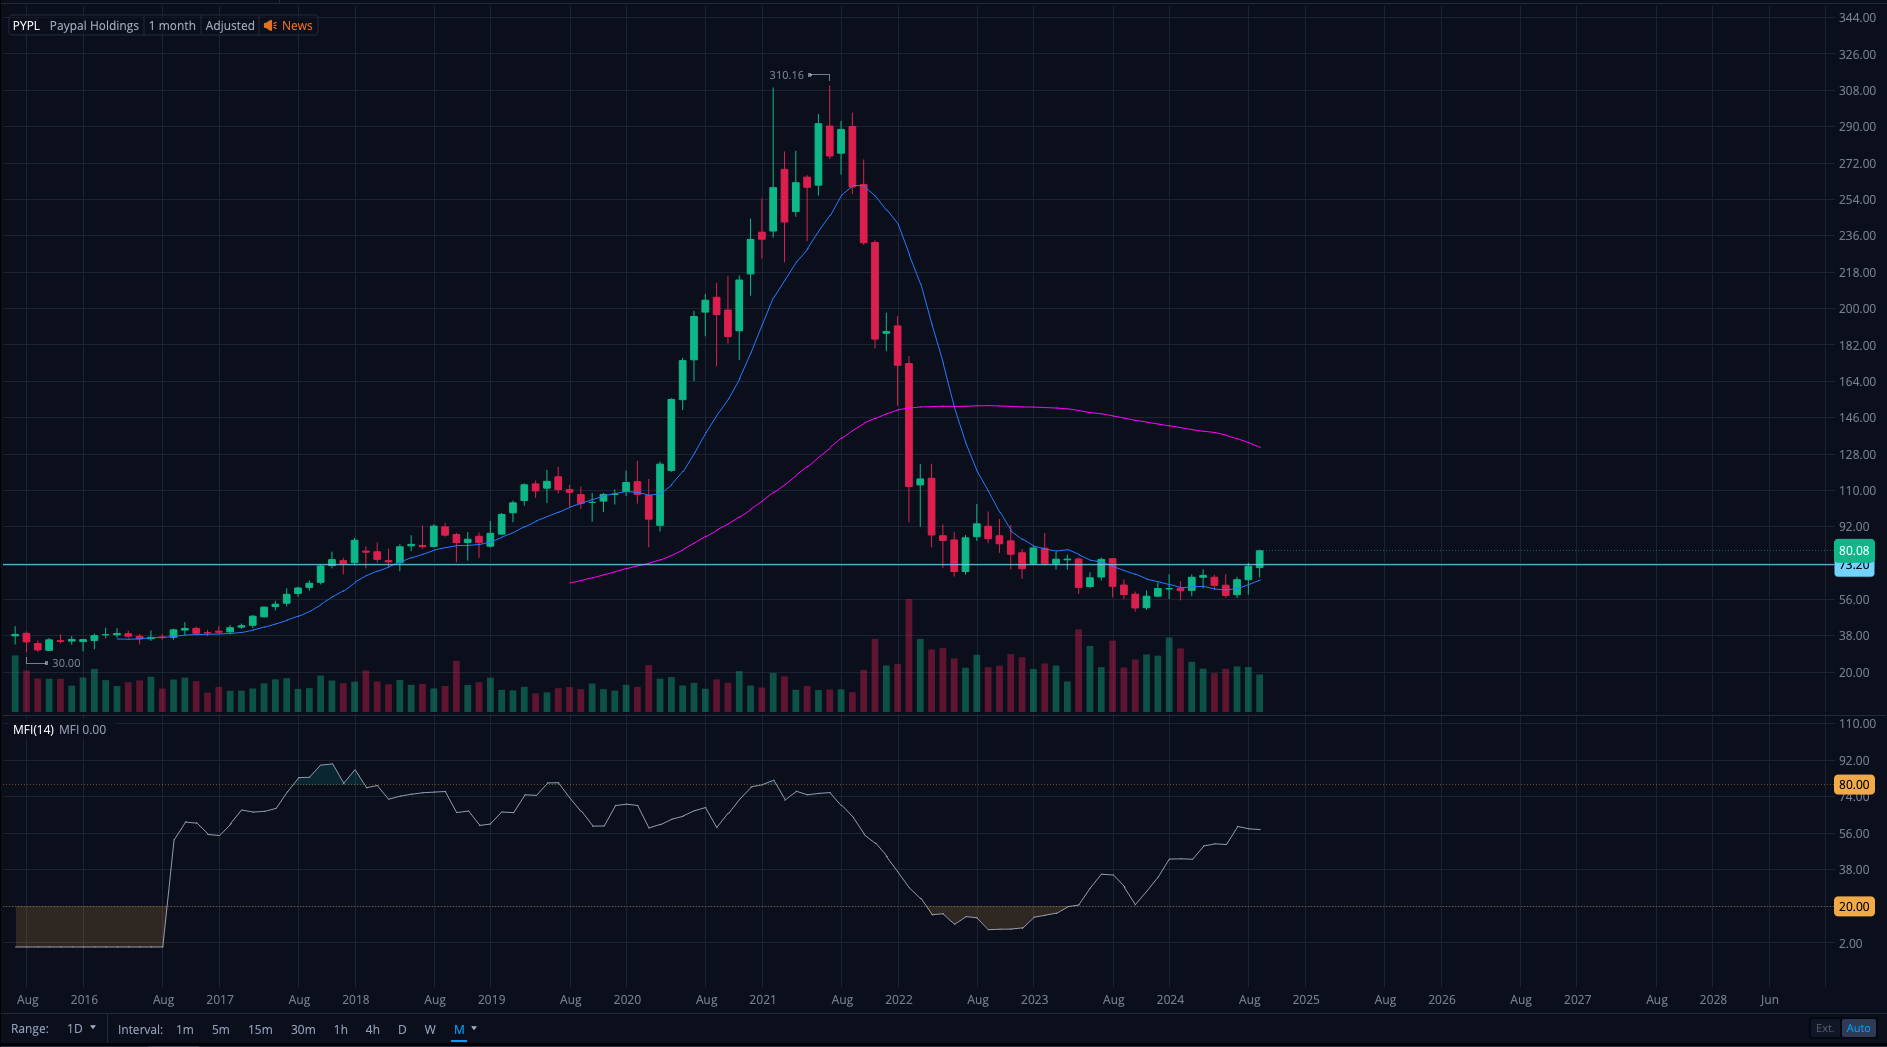
    For example, I’ve been looking into PayPal (PYPL) and Intel (INTC) for the last week or so. I truly think they have some strong things going for them — particularly PayPal. I’m not going to do a full analysis on these, but check them out if you get some time. PayPal owns more than double the market share of its closest competitors when it comes to online payment platforms. And Intel is undergoing a huge shift in their business model that will move them into the manufacturing game. With all the hype around Nvidia and AMD, I think Intel will see strong revenue over the next decade.

    Both of these companies have seen muted performance compared to their peers. The market seems to be obsessed with “the next big thing,” but we’ve seen how quick hype tends to die down. To clarify, I do think AI is going to revolutionize the world — I just think the moves so far have been exaggerated for where the market currently is. Here’s something I tend to tell myself a lot: “If everyone’s already talking about it, you’re too late.”
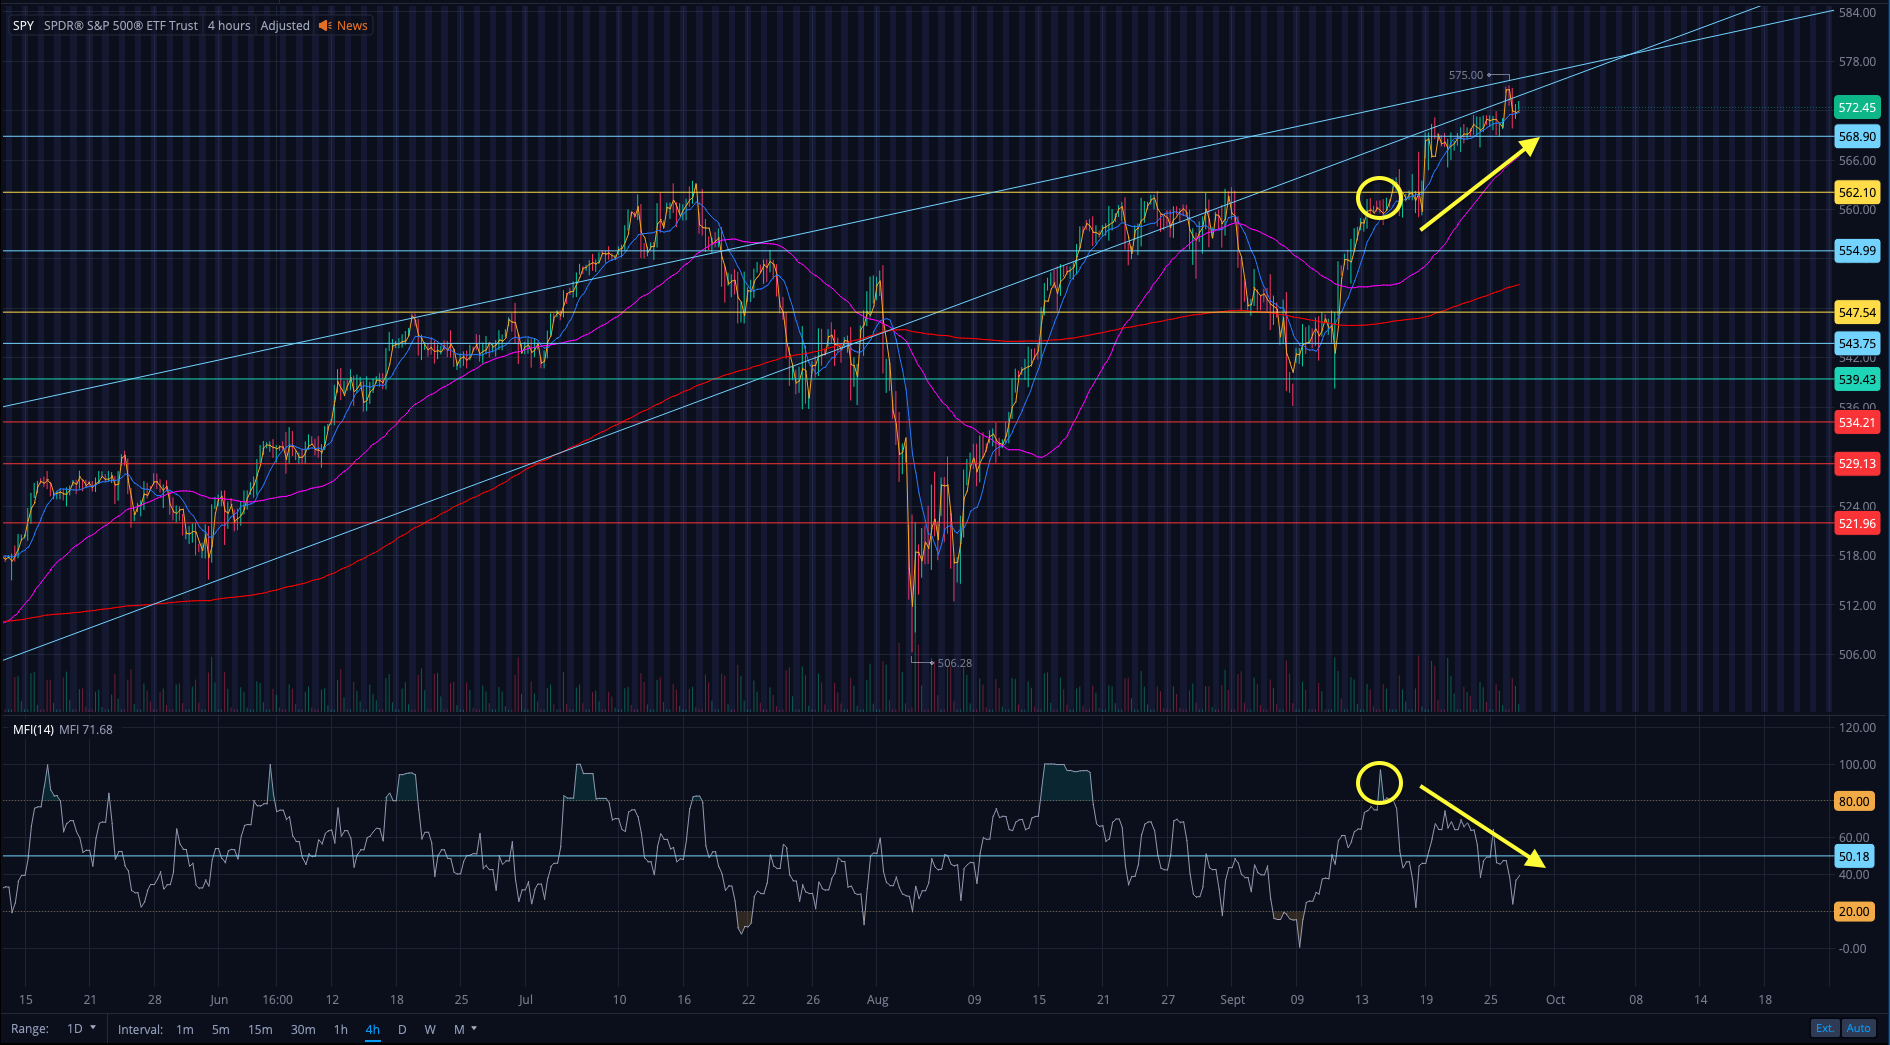
    Is the S&P topping?

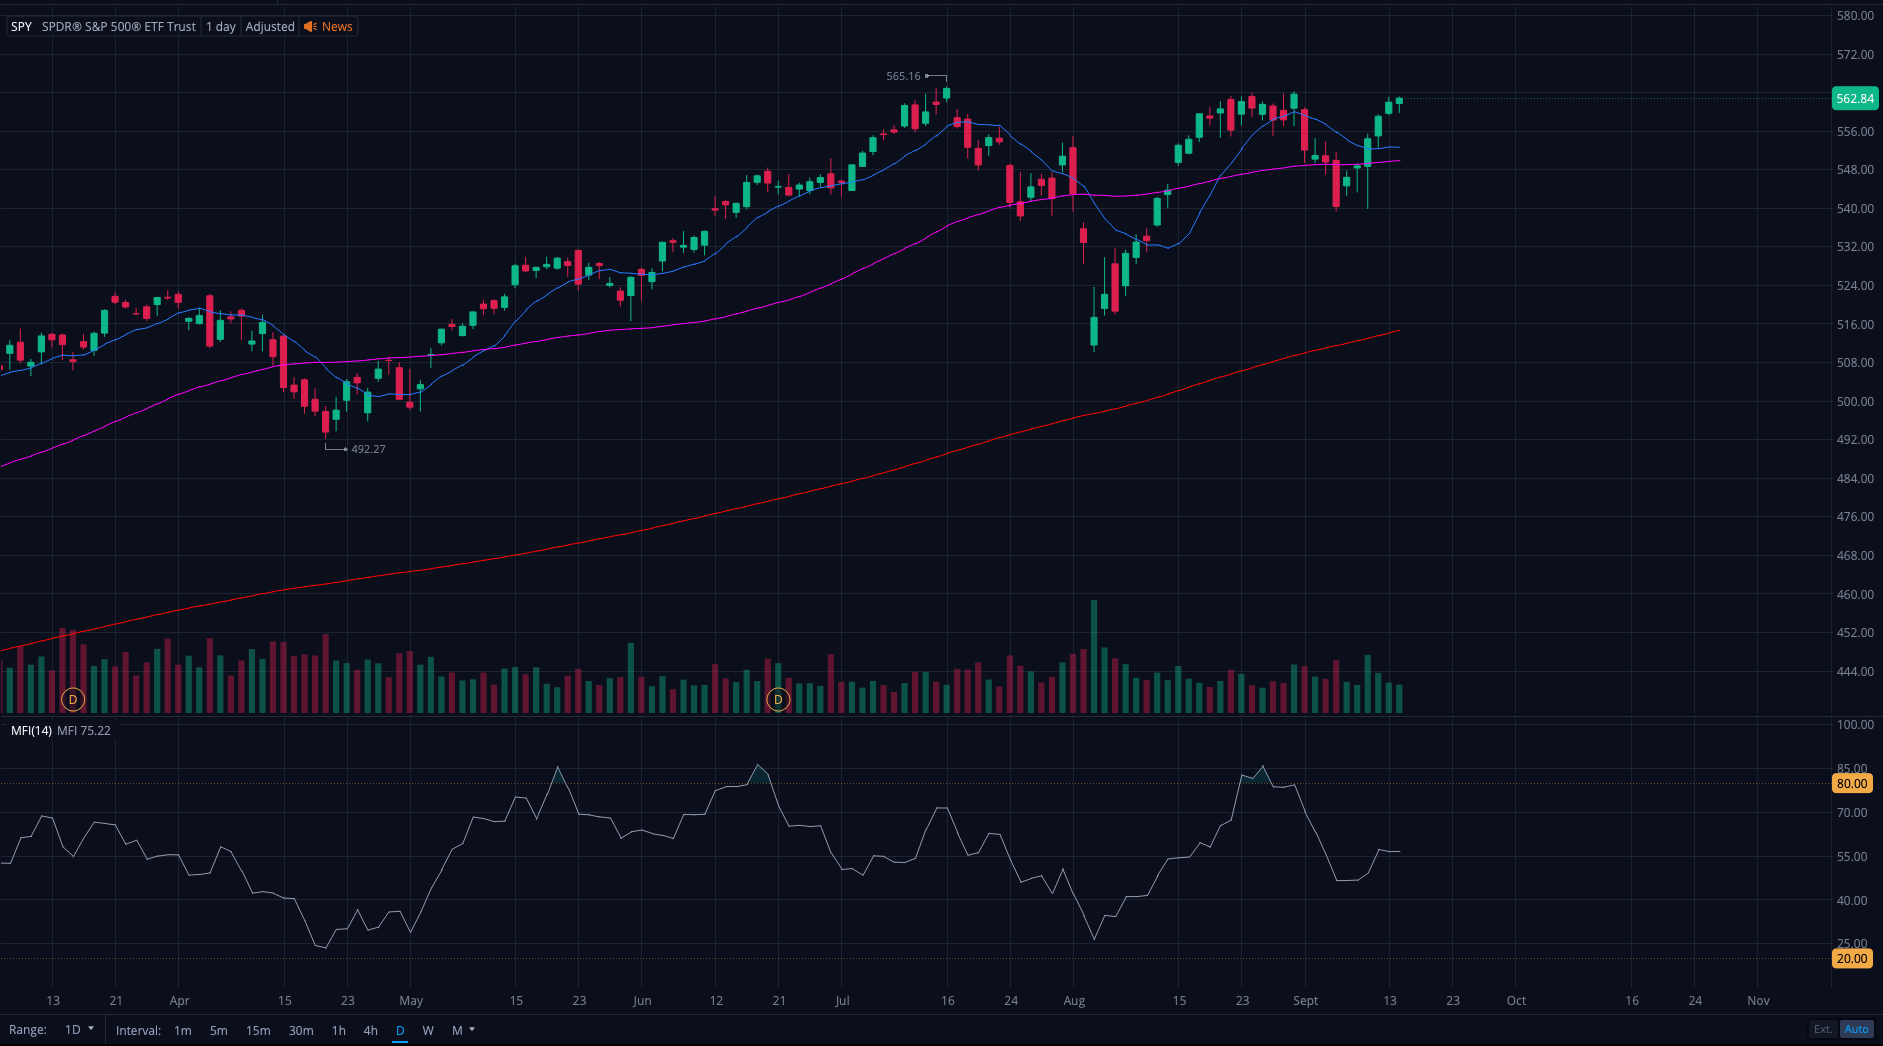
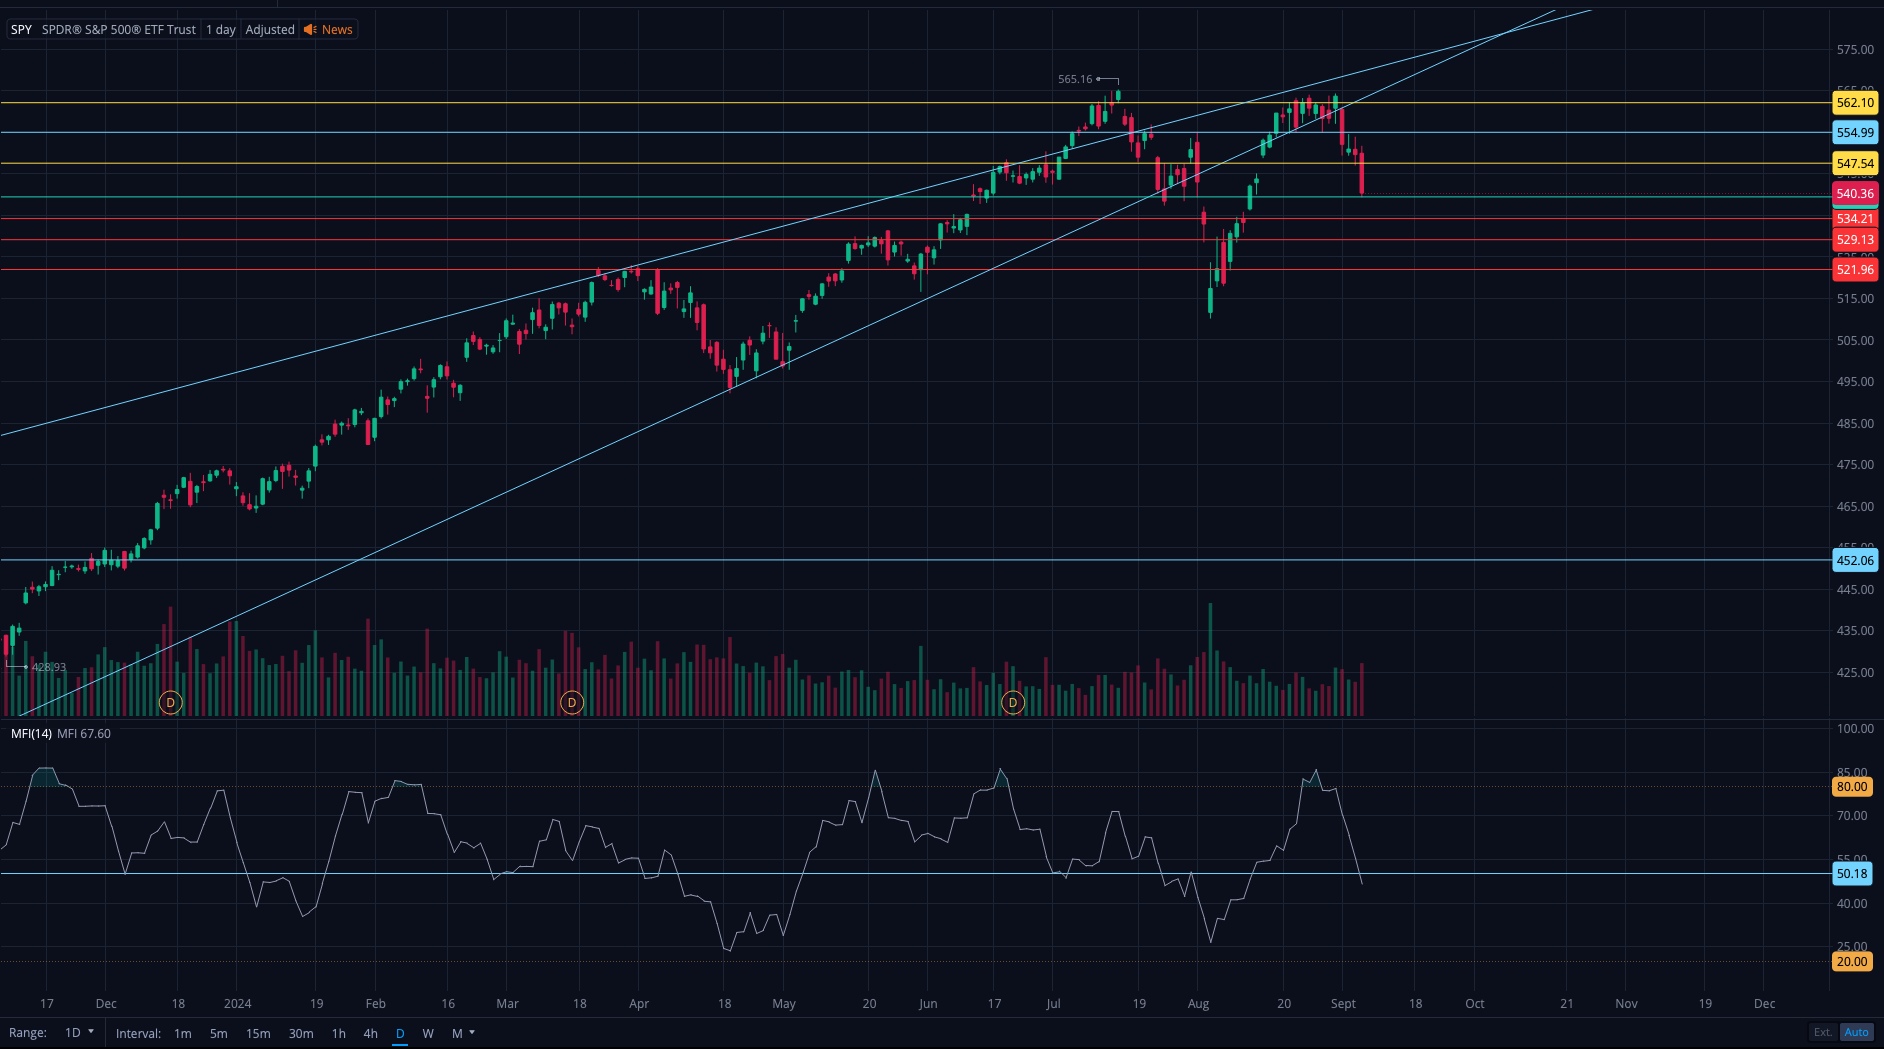
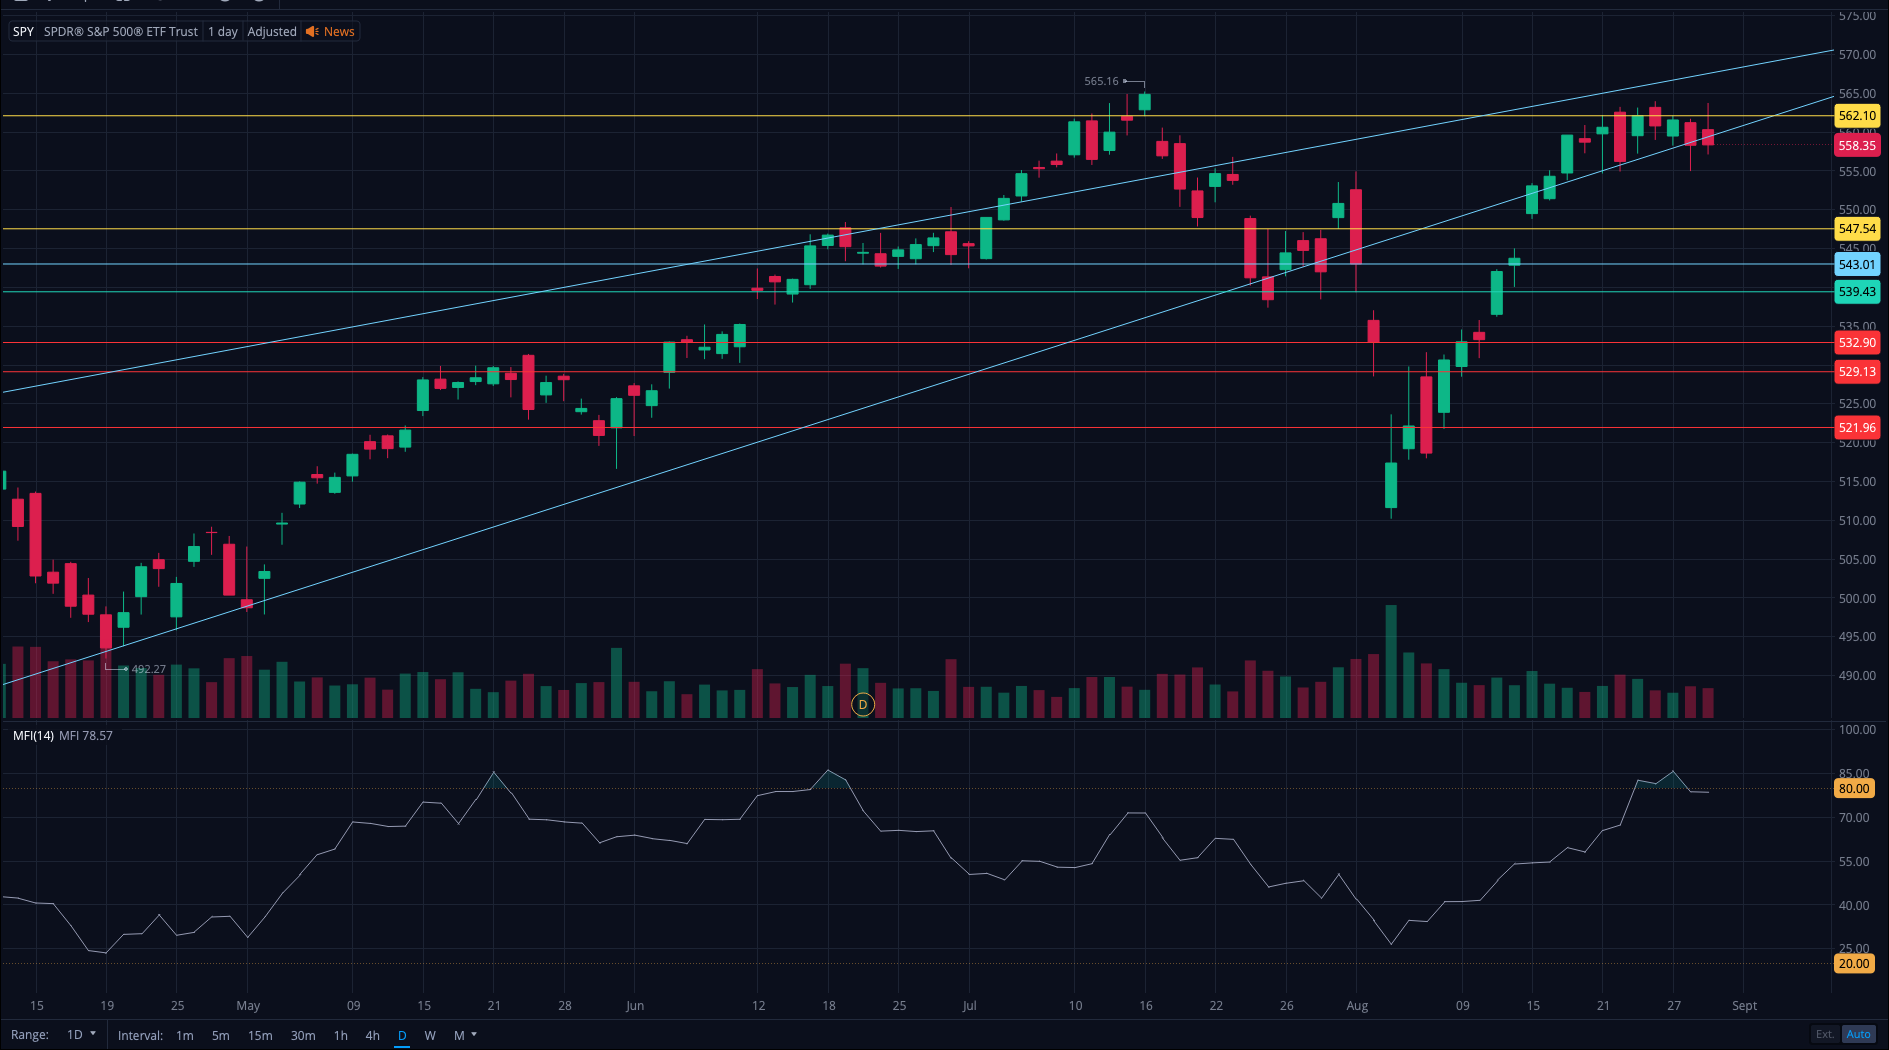
    SPY seems to be overextended anywhere over 562. That doesn’t mean things can’t change (we saw it back in January), but I am betting on the market topping very soon.

    I’ve accumulated short shares of SPYU, TQQQ, and NVDA, as well as some long-side positions in OXY and DVN. I wanted some exposure to oil after the recent downturn. These are the positions I’ll be riding out into 2025, albeit with some rebalancing along the way.

  • Preparing For FOMC

    Preparing For FOMC

    New podcast update

    Please forgive my recent absence – I’ve been working on an exciting new podcast and officially recorded the first episode this morning! Once we’re done with the editing it will be ready for publishing. When it’s officially released, I’ll provide some more depth on what to expect, but it’s meant for people who are interested in investing and don’t know where to start, as well as those who want to plan for retirement or broaden their horizons in the world of finance. I’m very excited to introduce it soon.

    50-Basis point hike priced in

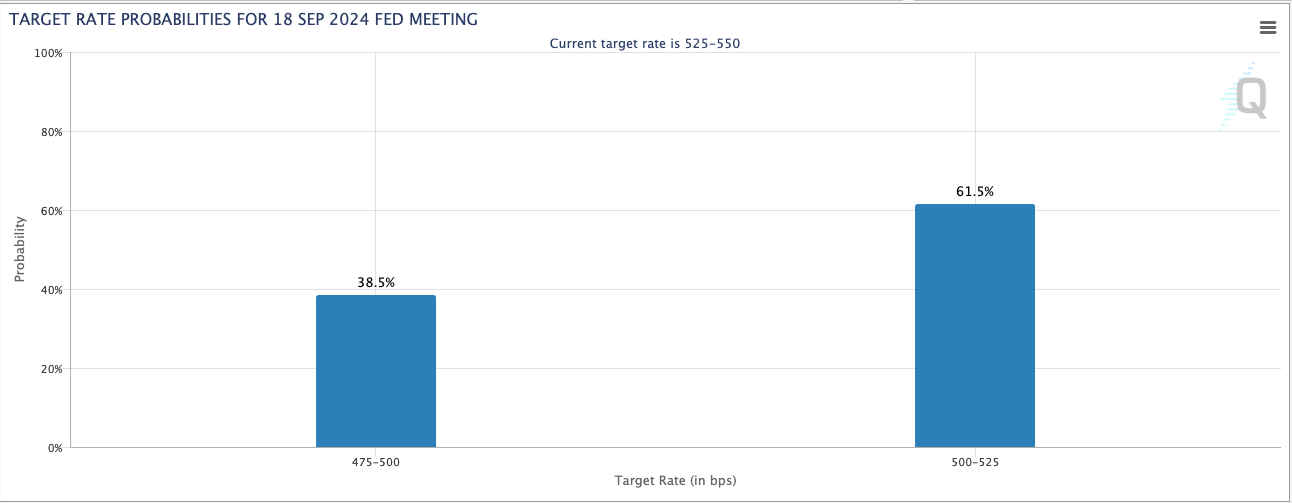
    As far as the market goes, it doesn’t seem like much is in store until FOMC on Wednesday. There’s currently a 67% chance of a 50-basis point hike, so I don’t expect too much surprise unless the FED starts at 0.25%.

    Post-FOMC rally

    I’m currently planning for a rally after the decision, in which case there will be an opportunity for me to add to my short positions. If the initial reaction is bearish, I’ll wait for a potential reversal after a couple of days.

    Potential bear market to follow

    SPY is currently sitting around all-time highs so I’ve accumulated some short shares here. However, I am looking for a better deal as the initial short-term reaction following a FED pivot is usually bullish. Afterward, the market typically sees a steep decline in the following months. This is the thesis I’m trading until proven otherwise.

  • SPY Finds Support and Bounces

    SPY Finds Support and Bounces

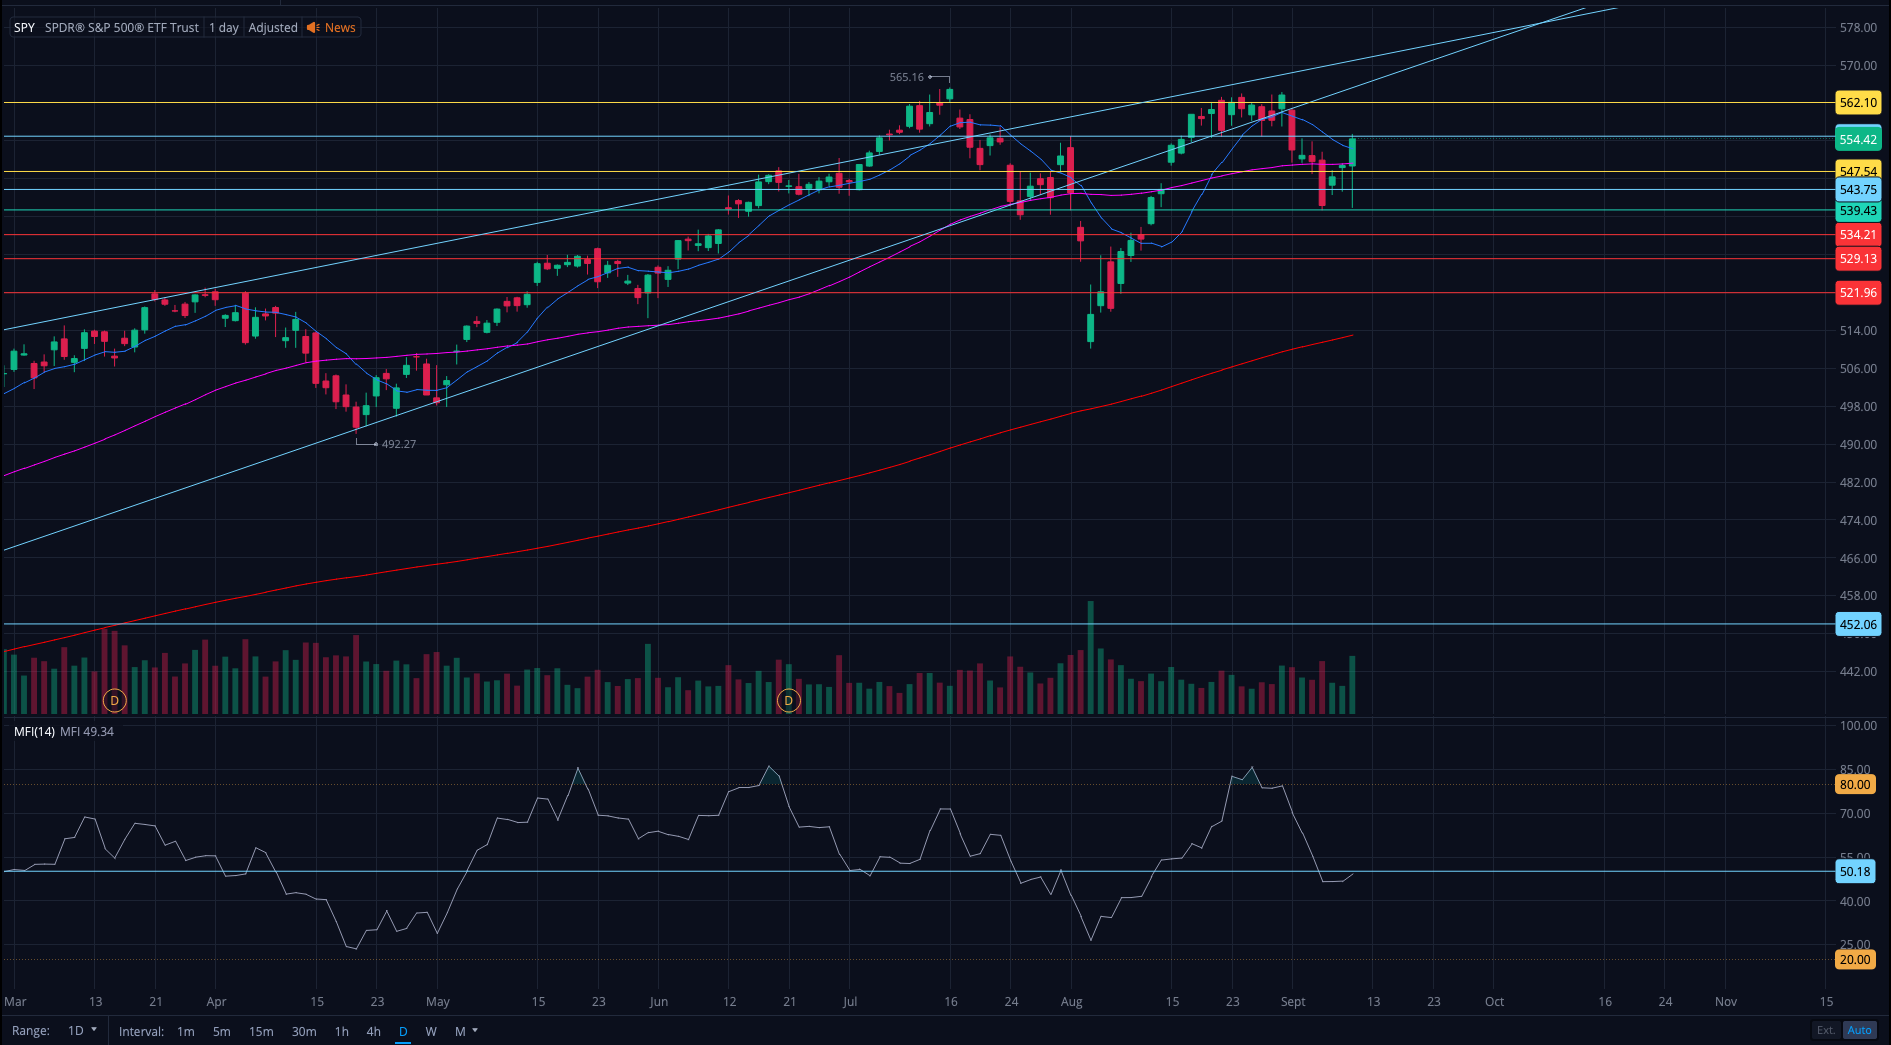
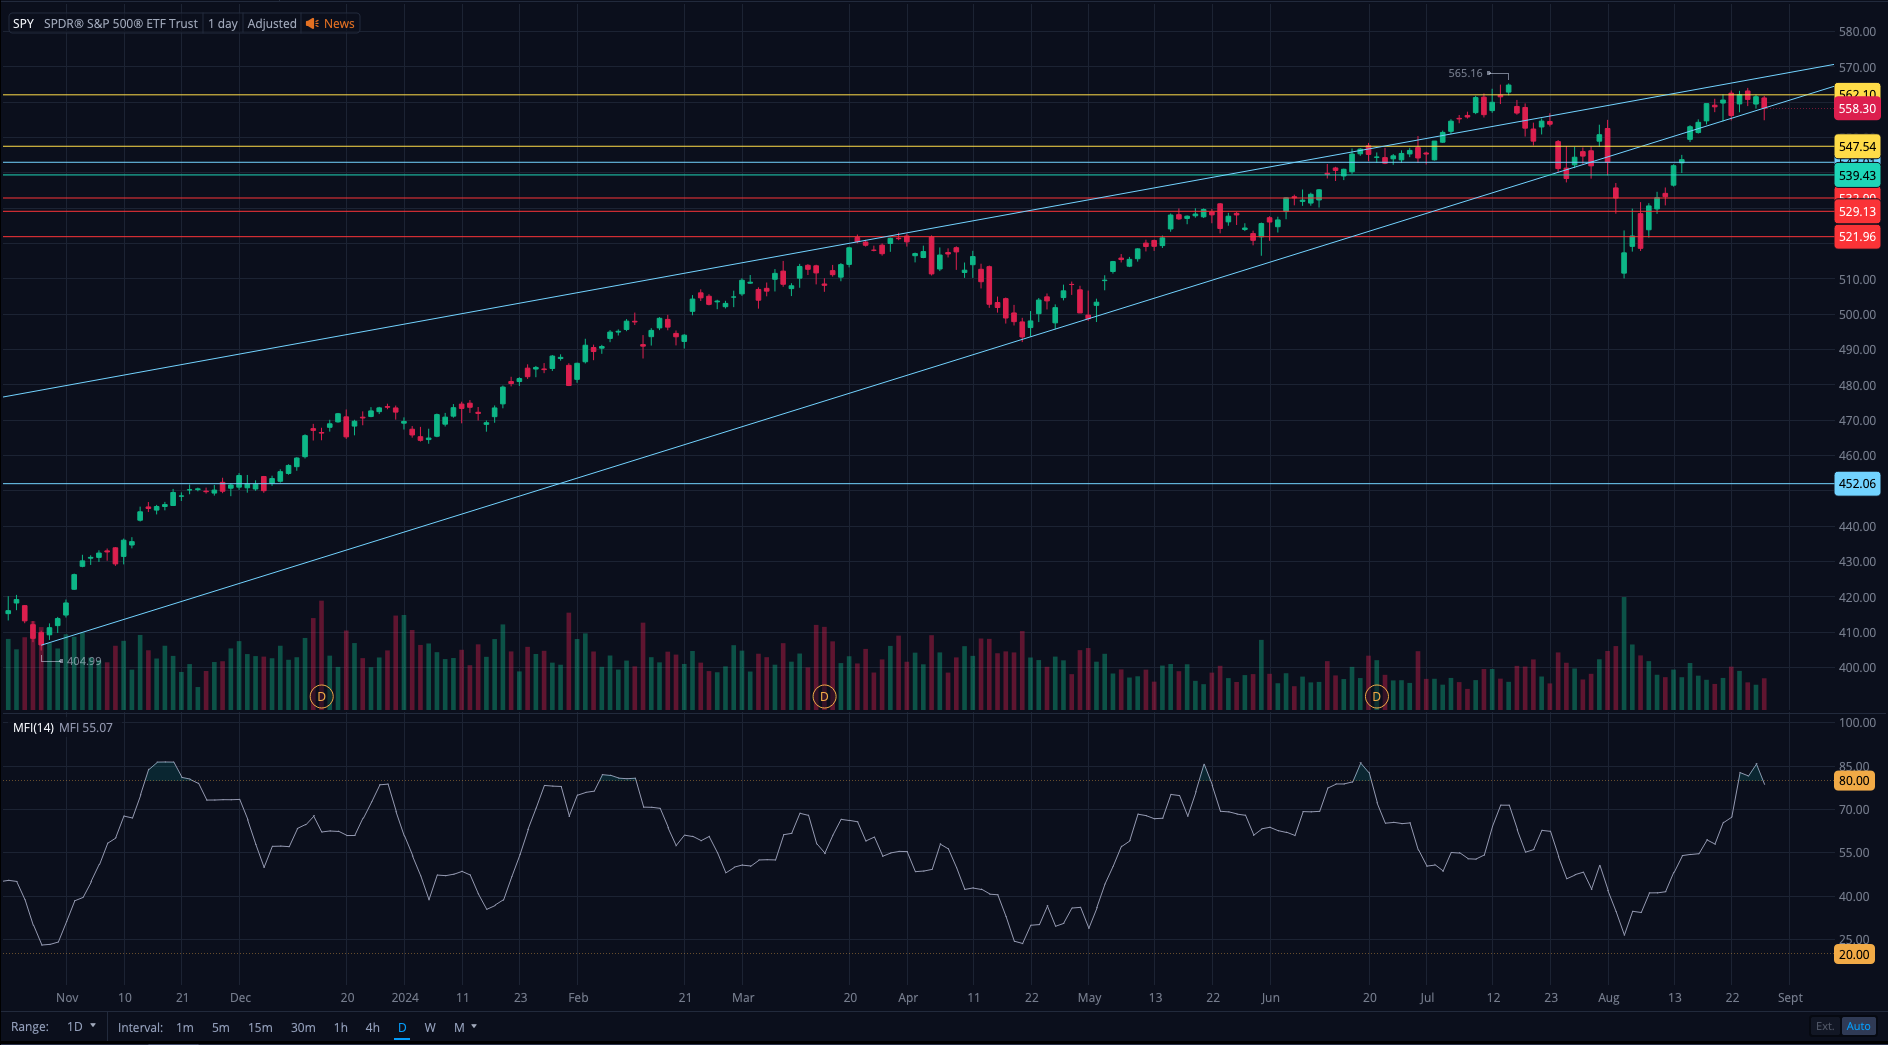
    It looks like SPY held support at 547 and saw increased buying in the second half of the day. Interestingly, MFI remains right around 50, so it’s possible that this bounce is short-lived (see July 31).

    Volatility

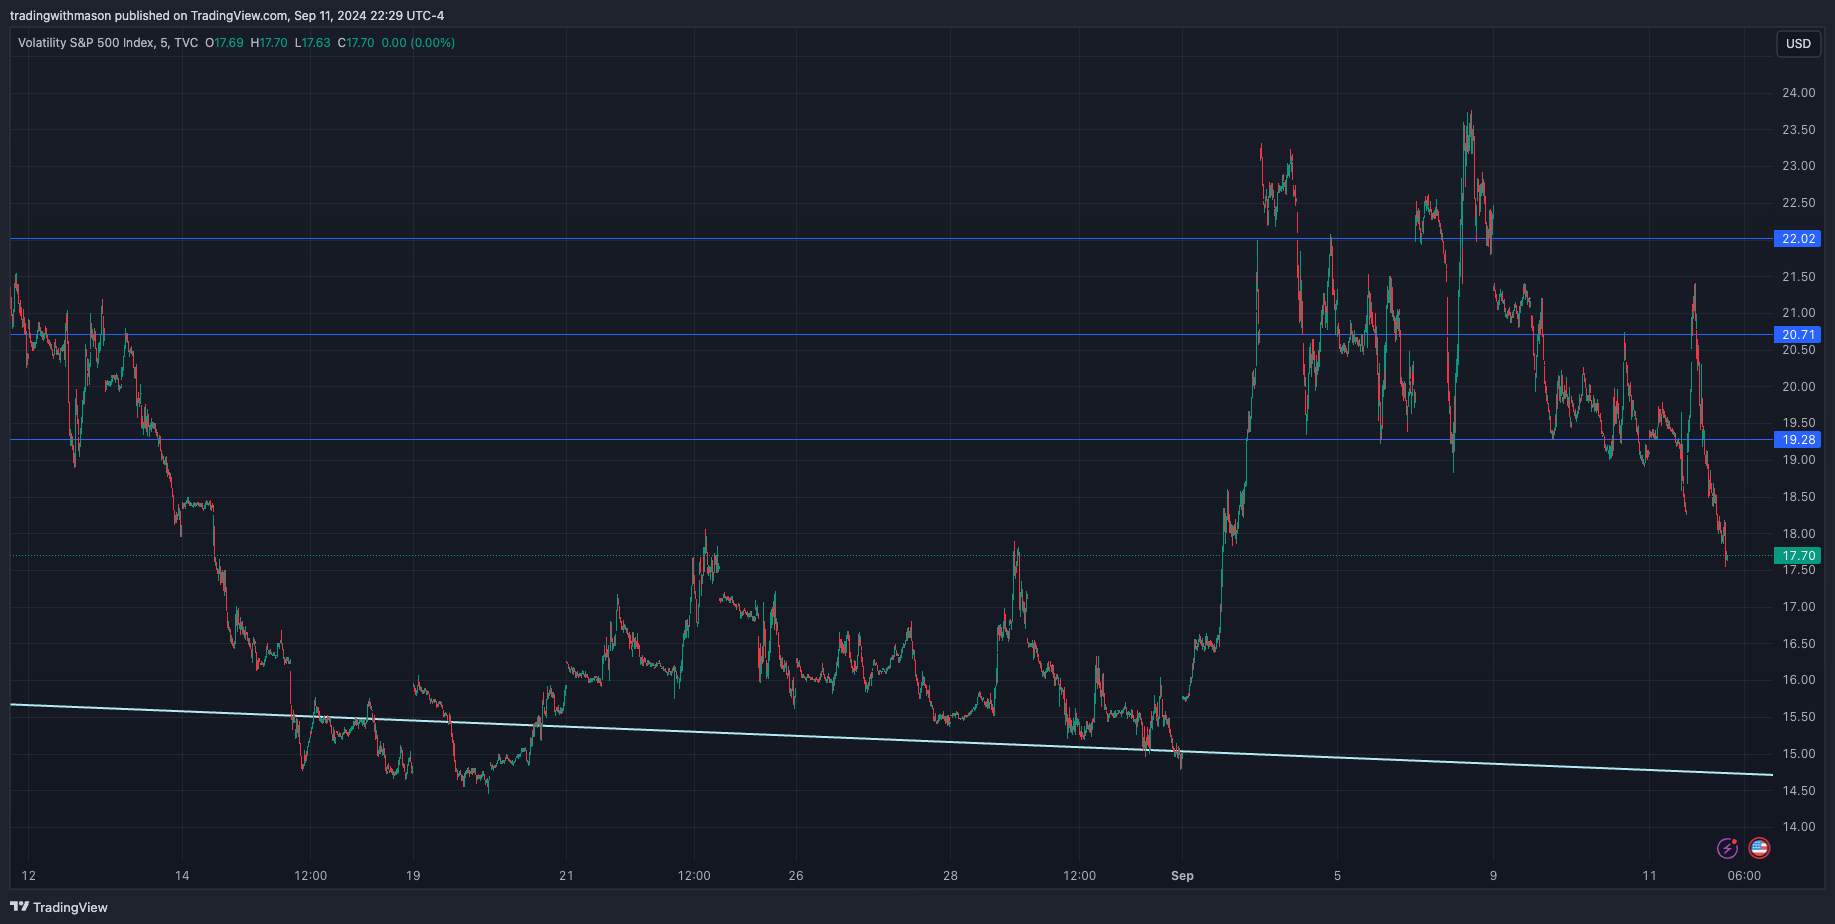
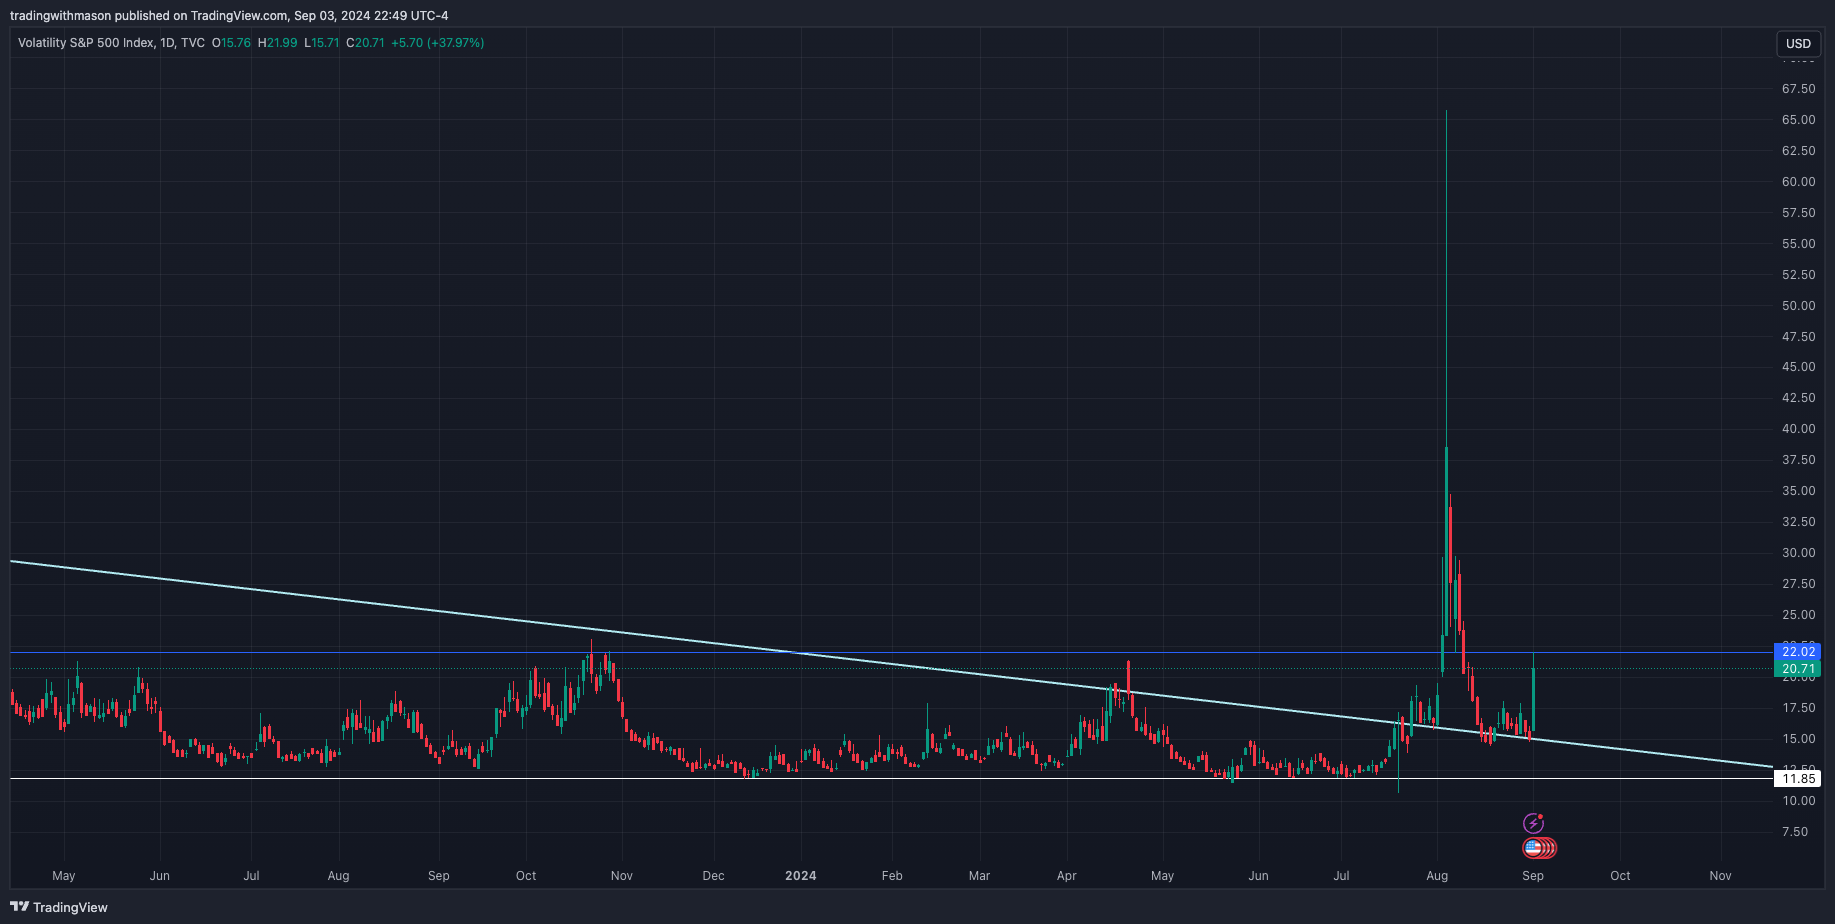
    The VIX broke down below 19 for the first time in a week. If fear continues dropping, SPY can head toward all-time highs. This is actually my preferred scenario because it gives more short accumulation opportunities. Since this can quickly turn into a momentum move, I’m going to let the dust settle before adding any more.

    Spy resistance levels

    Right now, SPY sits at resistance at 554.42. If we open above or break through tomorrow, the next resistance is at 562-565 (all-time highs). There are no technical resistance levels above there, so it’s important to remain level-headed and not revenge trade.

    Presidential debate and future market growth

    While the debate last night might have had some effect, I don’t it to remain around too long. The market is in dire need of price discovery after being up over 30% since November 2023. I am confident in shorting, but timing is essential.

    My plan for tomorrow

    If buying continues, I’ll let it start to slow before adding anything else. If the resistance at 555 or 562 puts up a fight, I will likely add more there. I’m also shorting NVDA, regional banks, and adding long shares to my position in DVN.

  • Is a Bounce Coming or Continued Selling?

    Is a Bounce Coming or Continued Selling?

    One of my major rules since I became a profitable trader was not to let my trading be driven by news. The effects are significant but usually die off pretty quick. Unfortunately for me, that rule hasn’t really been true since November 2023.

    I believe that traders need to identify rules that help them exploit the market and stick to them. Trading is a game of statistics, and while statistics don’t always play out right in front of your eyes, they are true enough over a long period of time. If you have a rule that says, “long if _” or “short if _,” and that rule has proven itself, it is my opinion that it should take a lot to make you forsake it.

    All that to say, election cycles have a substantial impact on how markets respond, but this market rally is already stretched to extremes. Daily MFI is looking like it’s going to continue pushing past 50, but we’ll see tomorrow. If SPY finds support here, a bounce is likely. If not, the trend is officially changing and any rally is an opportunity for me to continue adding short positions.

    I’ll have more details once we see where we open tomorrow, but I just wanted to preface my trading plan going into a new week.

  • Are Bulls Losing Control?

    Are Bulls Losing Control?

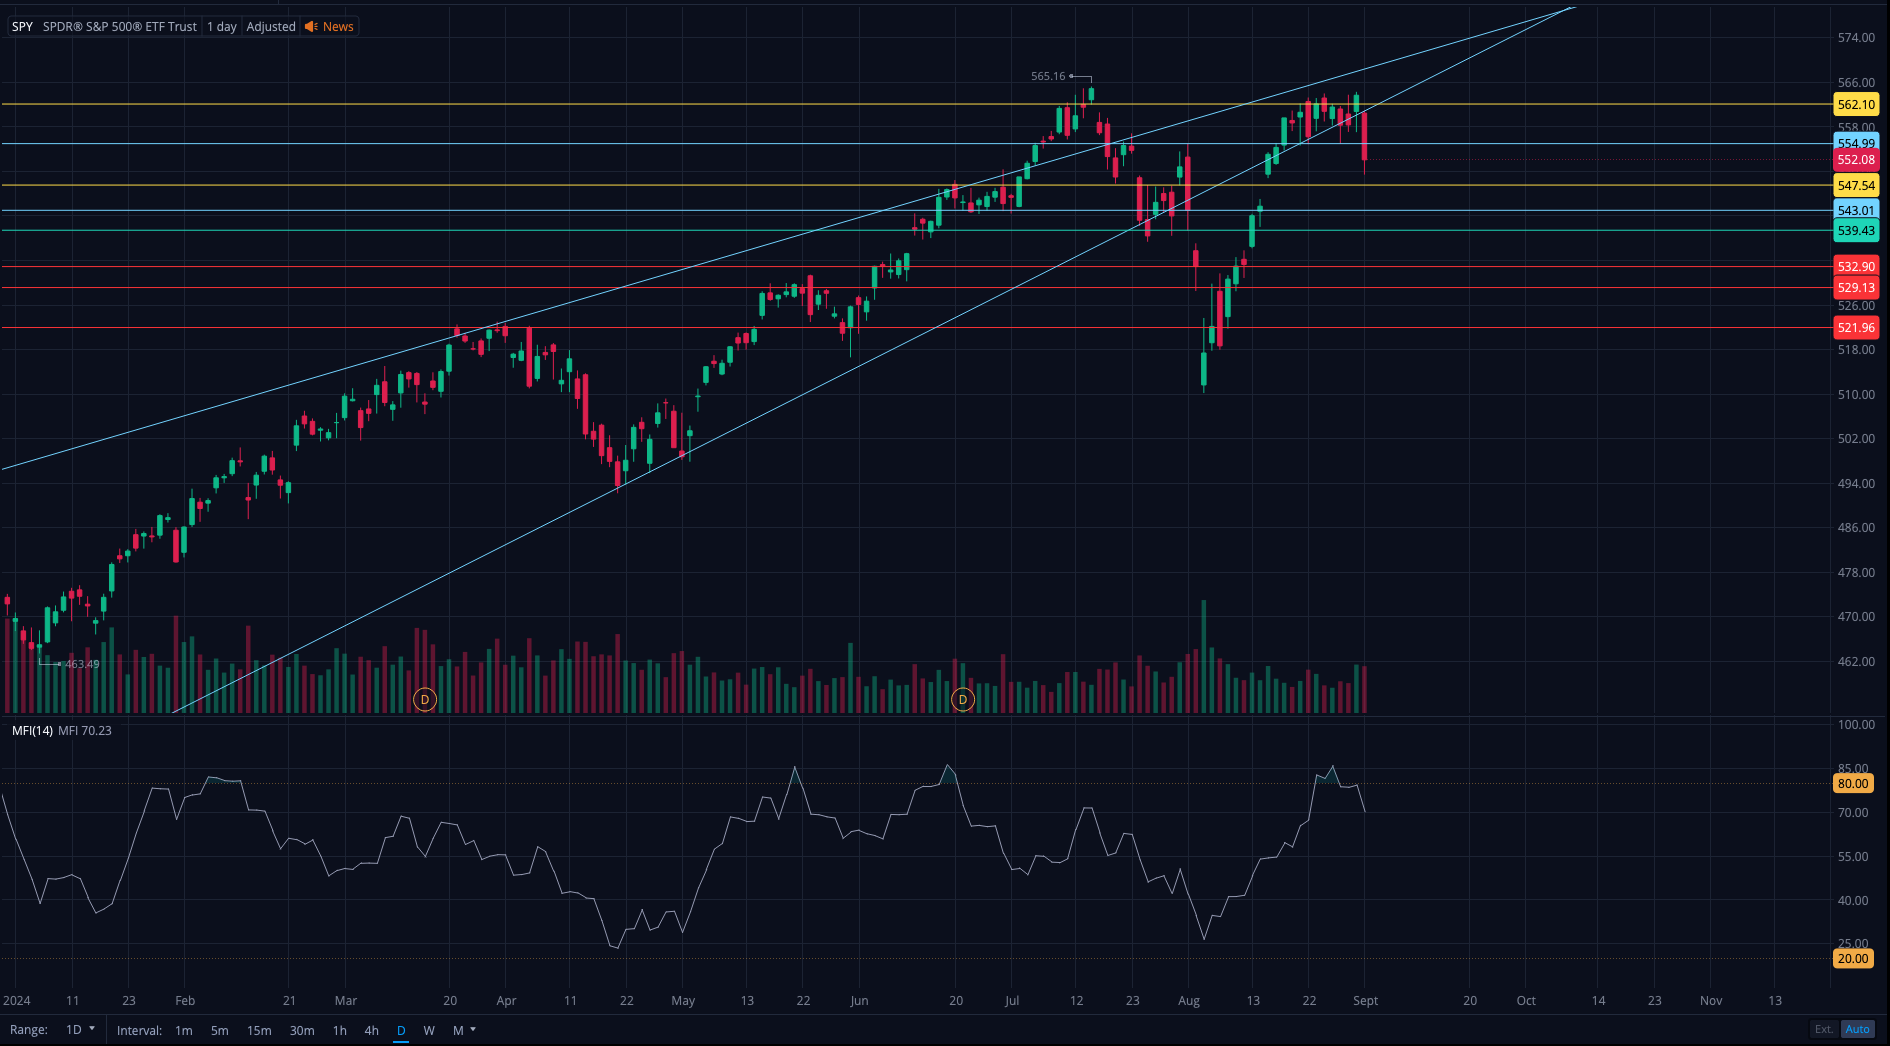
    SPY officially broke back below the rising wedge. I suspect more selling is coming over the days ahead, possibly into the election. However, we’ve seen SPY recover pretty quickly over the last year, so that’s something I’ll be careful of.

    Does this mean a new downtrend is forming?

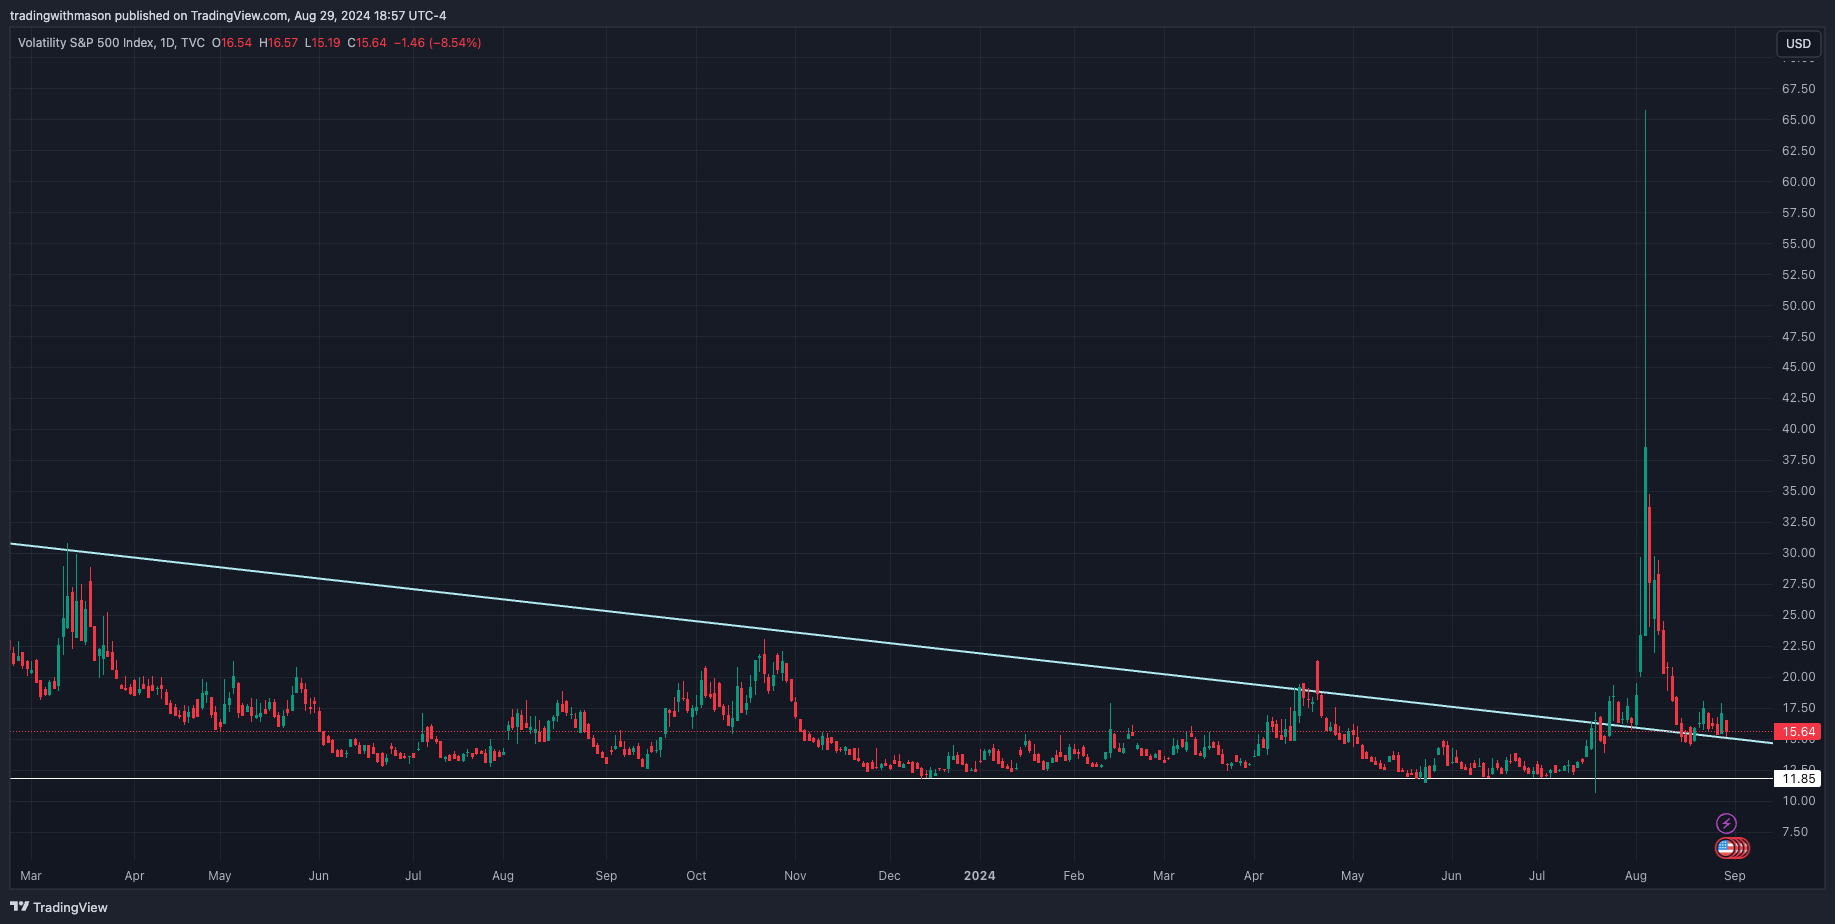
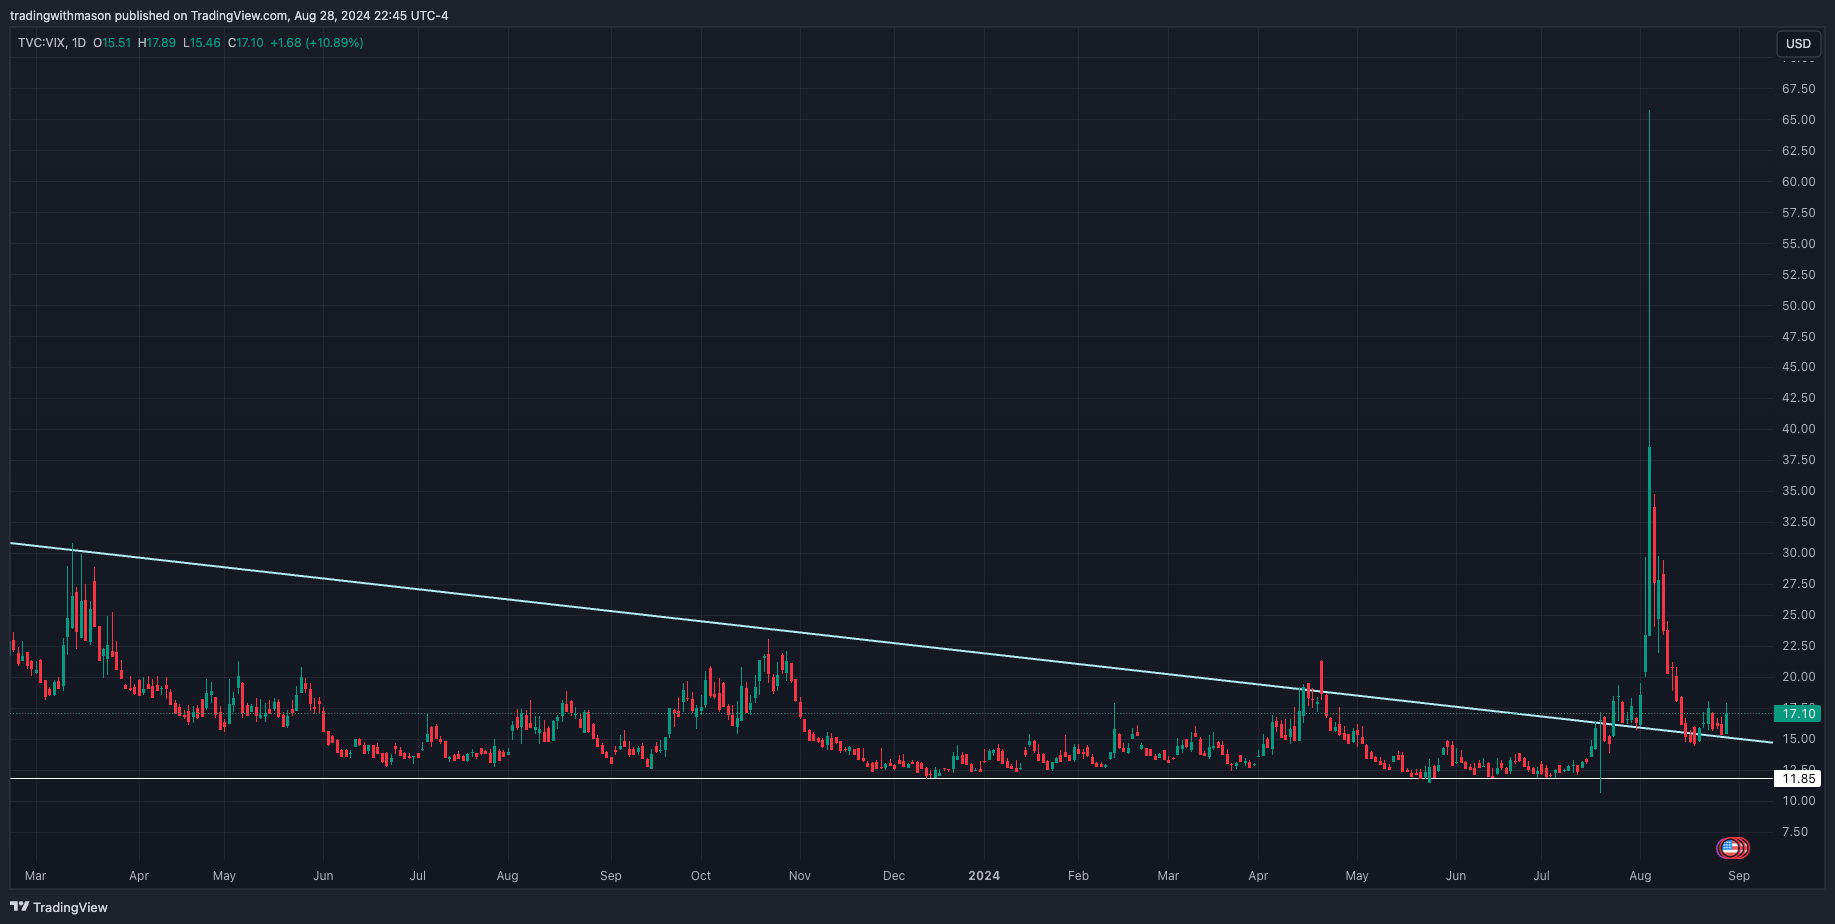
    Bulls have enjoyed pretty easy price action the last nine months, but anyone who’s been trading longer than 2024 knows that it isn’t always straight up. Volatility hasn’t really been a factor over this rally from 400 to 565, but that might change now that the VIX is finding some support. We’ll see if the VIX can continue to remain above 15 over the coming weeks.

    New resistance

    After the breakdown today, I’ll be watching for continued selling below 555. If SPY recovers that in the morning, we’re back to where we were last week.

    The massive selling we saw at the beginning of August isn’t what I’m looking for in a downtrend. Like the rally last November, this sell-off didn’t respect any technicals and was brought on by BOJ fears. I’m looking for slow and controlled selling to bring an air of price discovery back into markets.

    NVDA

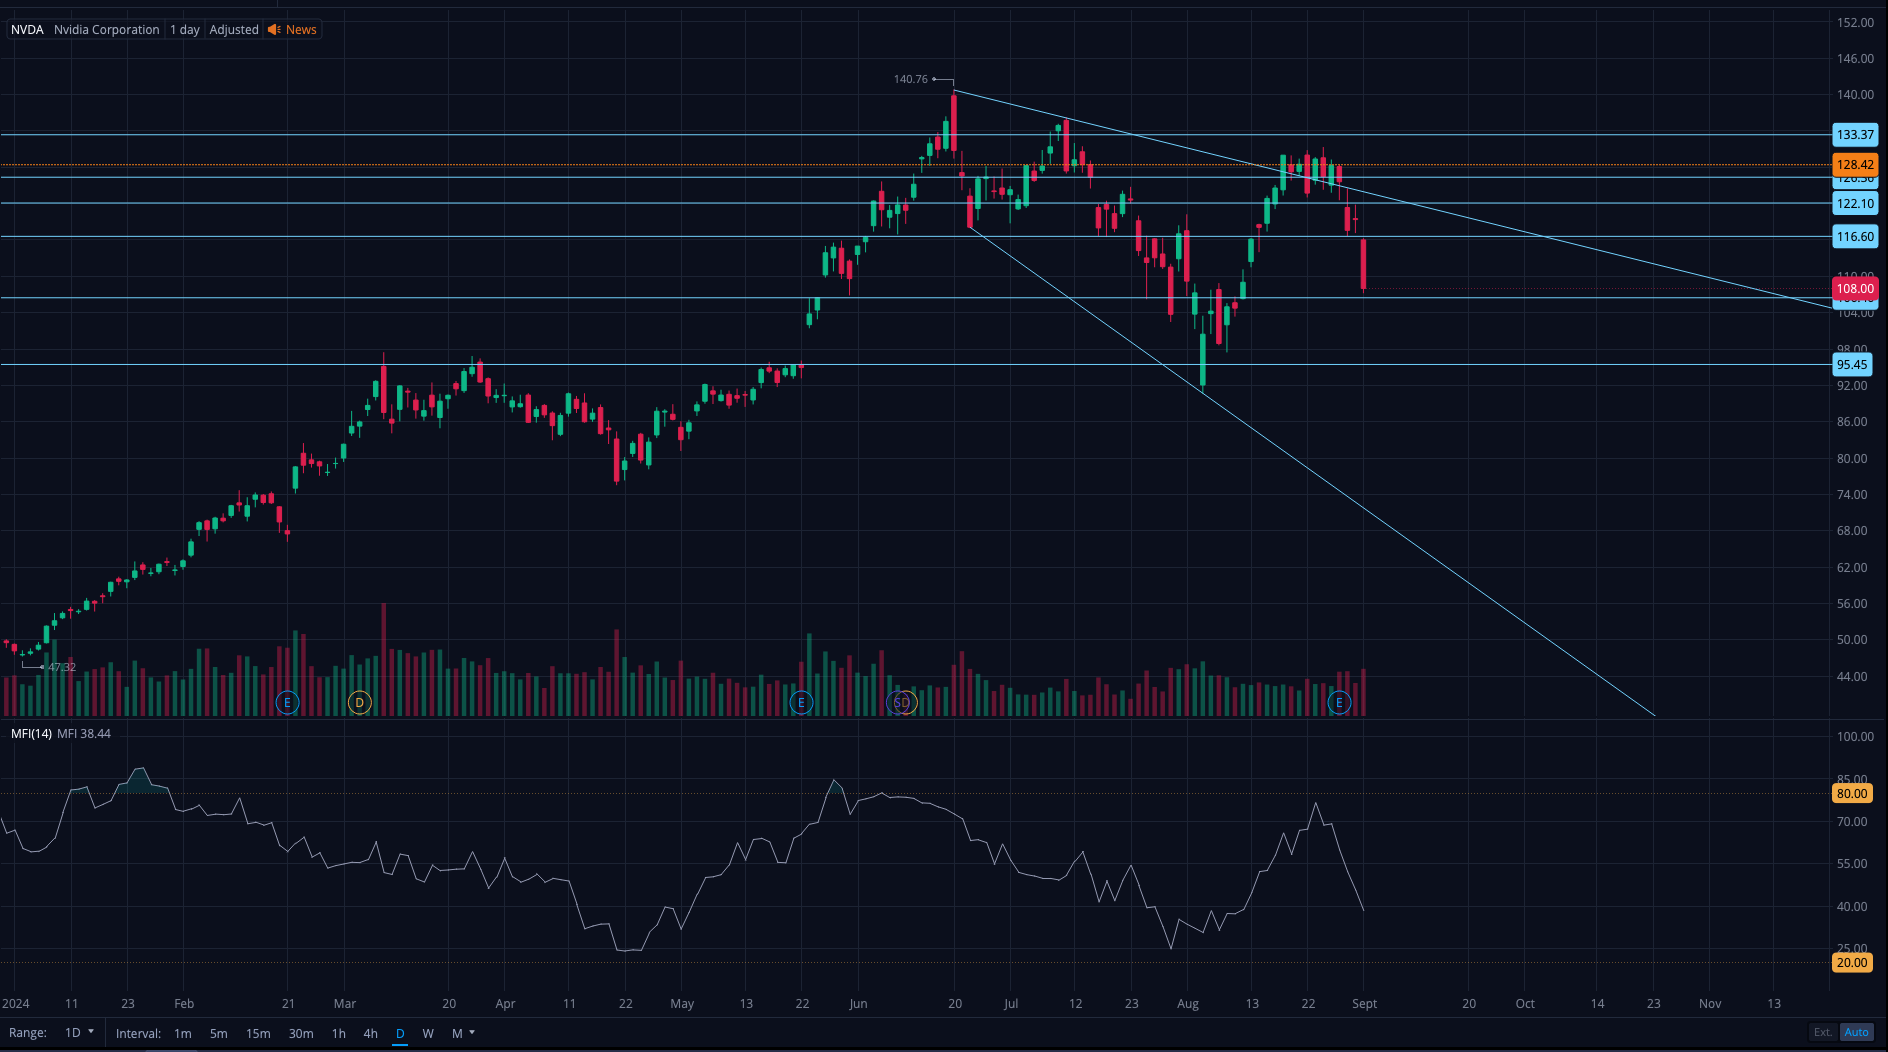
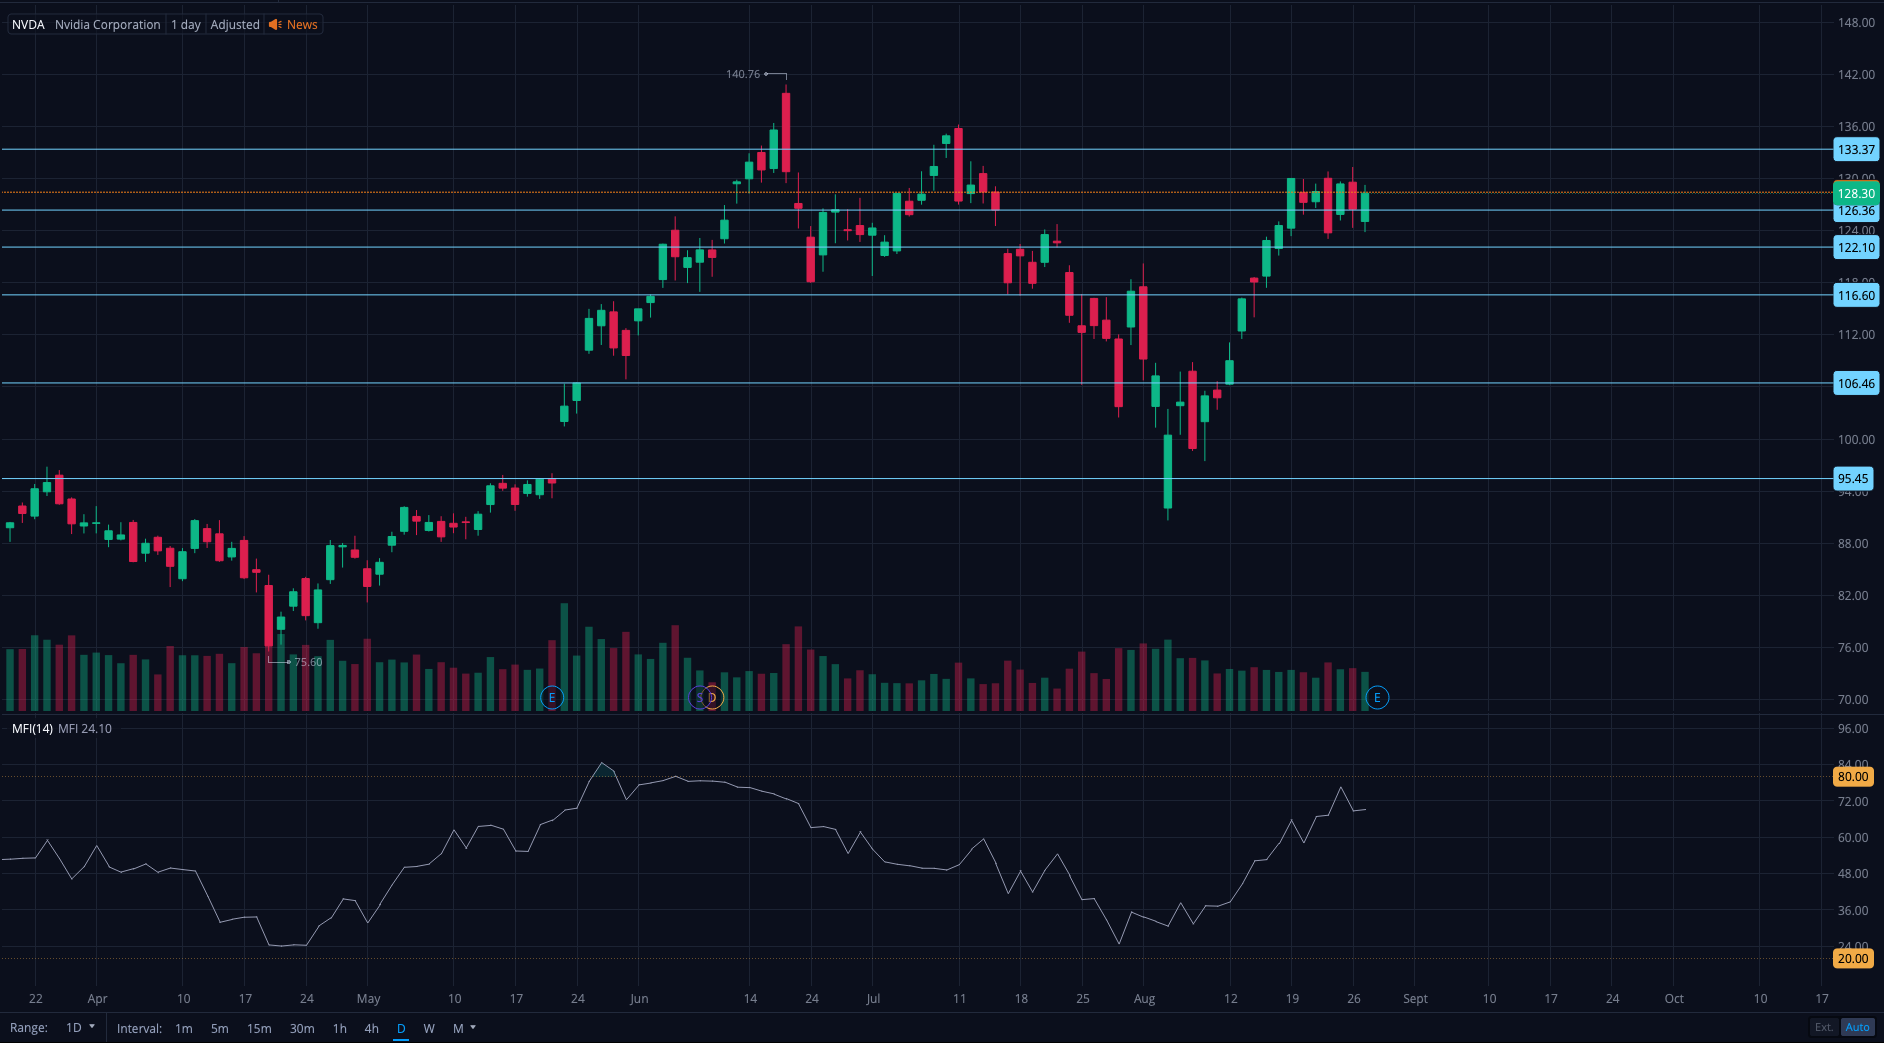
    Unlike SPY, NVDA is showing some technicals come back into play. We found support at 106 today, so I’ll be watching if price breaks down below that level tomorrow. Below that, there’s support at 95 and a potential descending broadening wedge pattern.

    Wrapping up

    These are the kind of conditions that make trading exciting. Traders can capitalize on violent swings as long as prices respect levels. I’ll be watching for more opportunities as the markets form some new support and resistance in this new era of volatility.

  • Stocks Recover From Nvidia Earnings

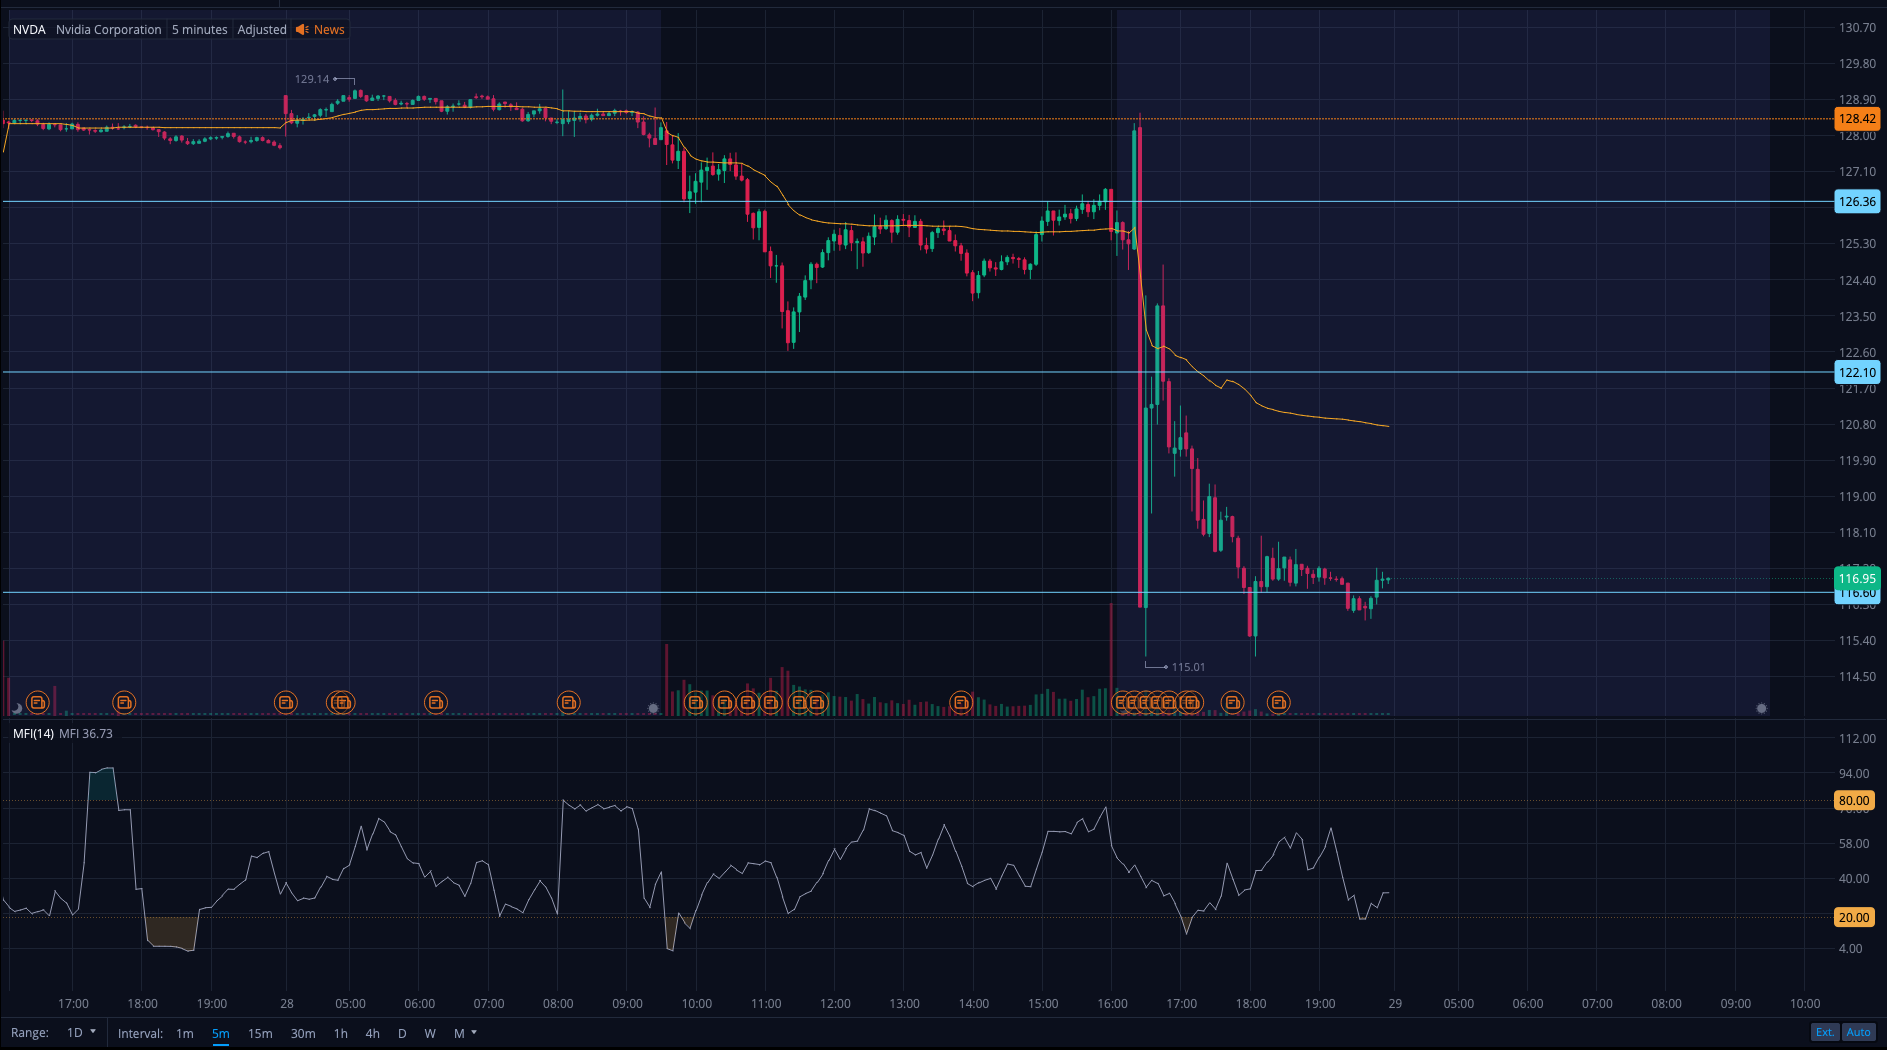
    In a shocking twist after the already surprising drop yesterday, SPY recovered completely but still rejected 562. Likewise, NVDA was up premarket but sold off to retest 116 support, closing slightly above it. QQQ followed a similar pattern but didn’t quite reach lows after yesterday’s after-hours.

    SPY is still maintaining its rising wedge pattern. As long as price remains supported, all-time highs are still on the table. I’ll continue adding short positions and any rally from here is an opportunity for a better price.

    BOJ fears at the beginning of the month already showed how fragile this market is, and the VIX remains elevated from recent lows. I will continue systematic accumulation despite any new headlines that come out into the election.

  • Nvidia Earnings Sell-off Affects Broad Market

    I am a little surprised at the move on NVDA on earnings. I touched on it briefly last night, but it seems that the attitude towards tech may be souring, or extra liquidity isn’t able to keep this propped up anymore.

    VIX finding support

    The VIX has maintained support at the newly drawn breakout line. I prefer this drawing to my original because it’s confirmed by over three weeks of price action. If the VIX continues to rise above 15, this may be the beginning of the real correction the market needs.

    Major correction potential

    I’ve been pretty vocal about a major doom scenario playing out (SPY visiting 450 or lower). It seems that many have forgotten the untested strength that propelled SPY from 400 to almost 600 in less than a year. This kind of market action doesn’t go unchecked forever, and the market has a long way to fall before any real support catches it.

    Adding more short positions

    If SPY stays below the rising wedge tomorrow, 555 becomes my new top for short positions. When the market begins its correction, it might be hard to rely on bounces to add. Market sentiment has radically shifted in favor of bulls for the last few months, so each bounce may signal “recovery” to those who have become complacent in buying the dip.

  • All Eyes on Nvidia Earnings

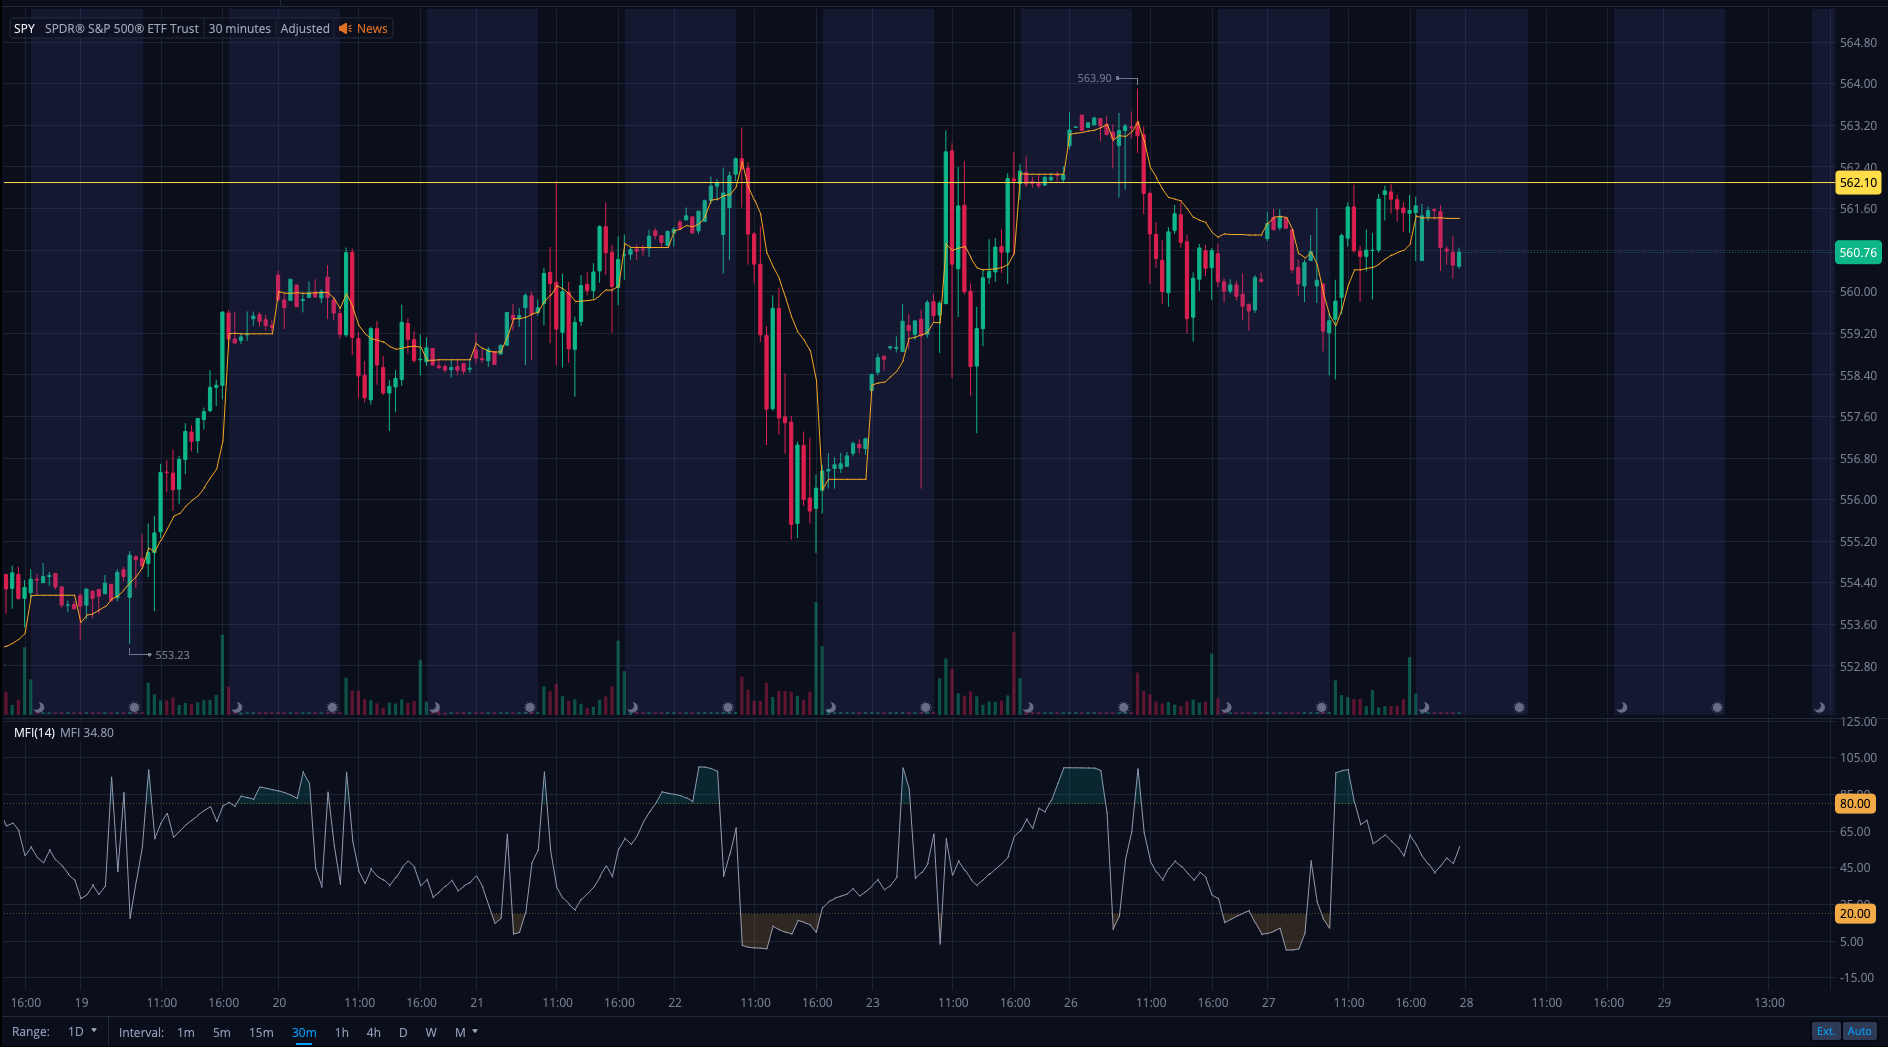
    SPY has rejected 562 for five consecutive trading days and depending on how you draw the breakout line, the VIX is sitting right at support.

    NVDA earnings

    NVDA is expected to release earnings tomorrow after the bell, and the implied move is almost 12%. SPY and QQQ would surely respond to whatever move NVDA has, up or down. If this were a normal market, I would expect a red day tomorrow based on technicals. That said, technicals haven’t offered much with the massive amount of liquidity going into such a select group of stocks.

    My plan

    I will probably elect to sit out of the market tomorrow and evaluate where we are on Thursday. If the market rallies on NVDA earnings, I’ll start adding to my short positions again.

    Earnings warning

    To any newer traders/investors out there: you don’t need to fear missing out of earnings. The moves afterward are generally safer and there’s always another opportunity. Earnings turn trading into gambling and in my experience, gamblers don’t usually come out on top over the long term.

  • A Pivot is Coming: What This Means For Traders and Investors

    Powell signaled potential rate cuts on Friday. The market currently prices in a 60% chance of a 25 basis point hike and a 30% chance of a 50 basis point hike, with no consideration for rates remaining unchanged.

    Economic pricing

    It’s important to note that much of the economy has already factored in rate hikes. I spoke to a mortgage officer recently and he said that current rates already reflect 2-3 anticipated rate cuts for 2024. The crucial question is whether an official pivot will trigger a market rally or result in a sell-the-news event.

    SPY resistance

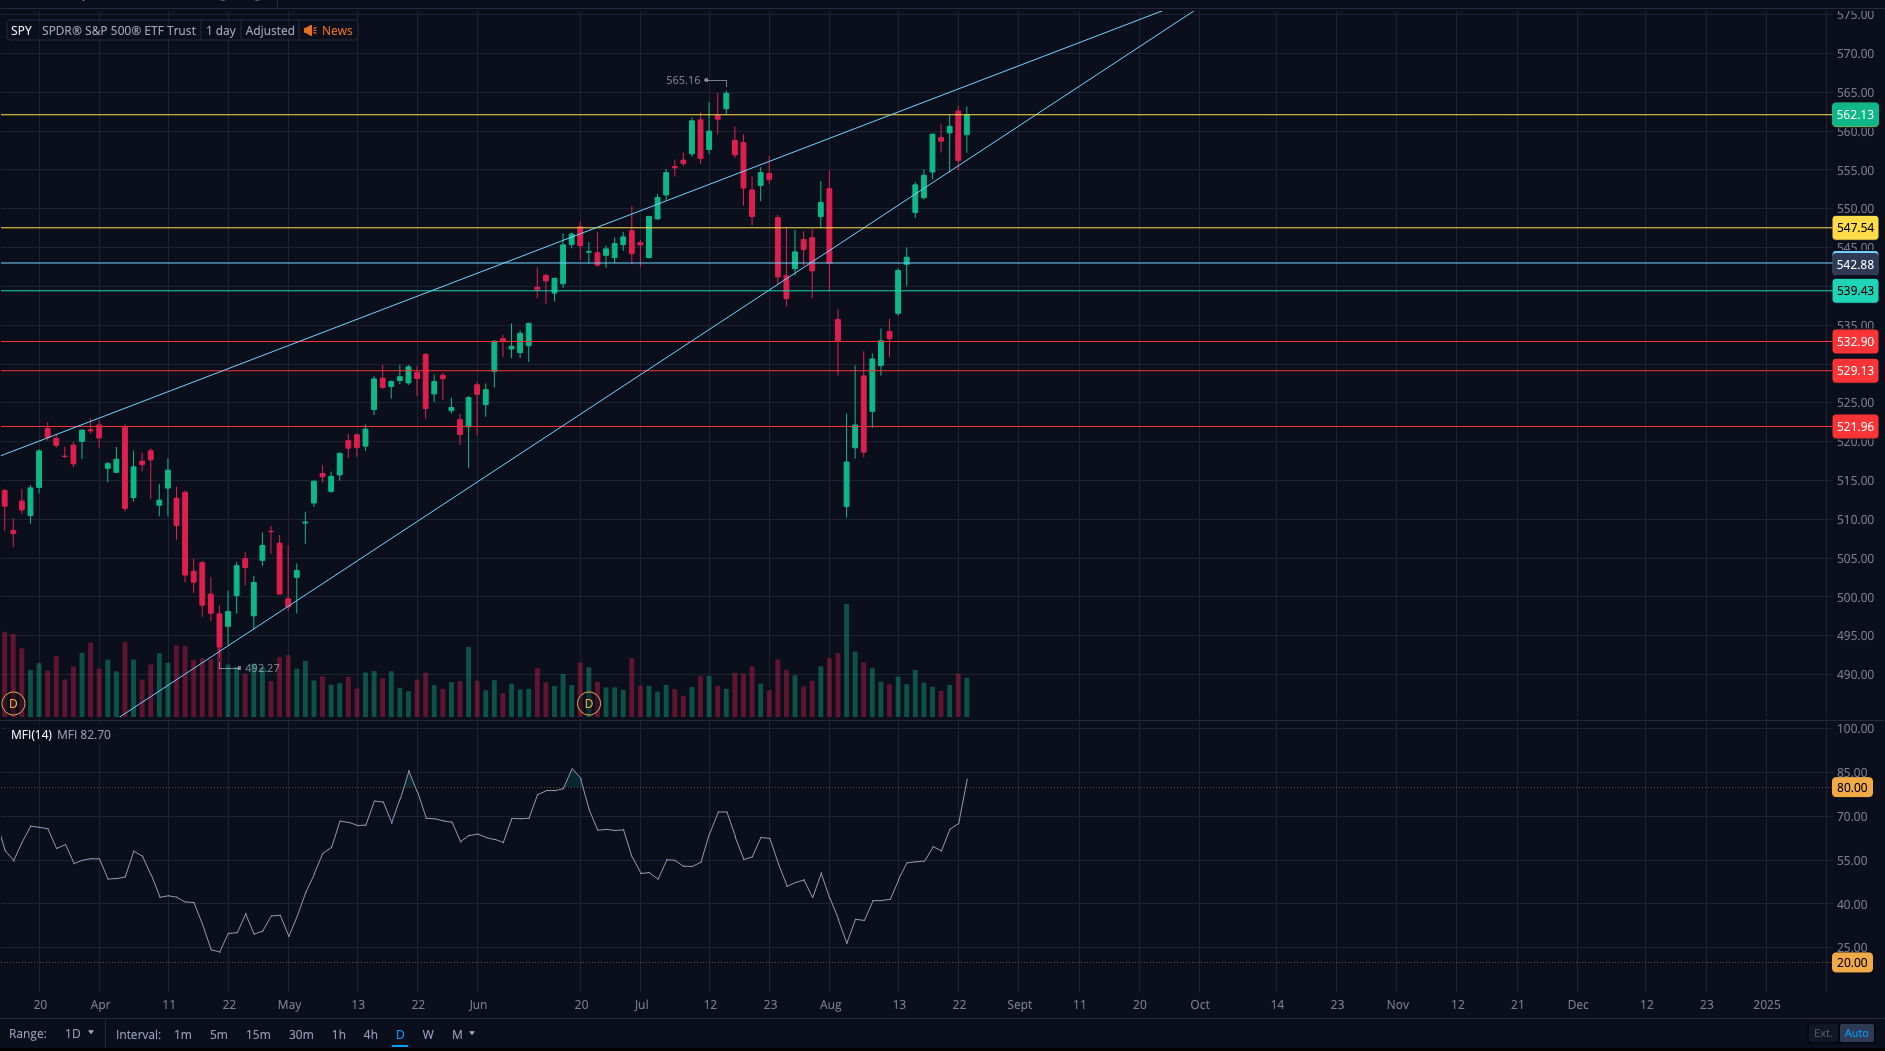
    With SPY failing to break above 562 on Friday, I’ll be watching this level tomorrow. Given recent trading patterns, SPY might gap up in premarket, potentially skipping this resistance. If this occurs, significant volatility may not return to the market until the FOMC meeting on September 18. I’ll also be keeping an eye on the rising wedge since we’ve recently moved back into it.

  • Preparing for Powell at Jackson Hole

    SPY saw some selling today, but only enough to retest the rising wedge. The selling was also in line with a rising VIX, so unless volatility continues tomorrow, this may have just been a temporary red day.

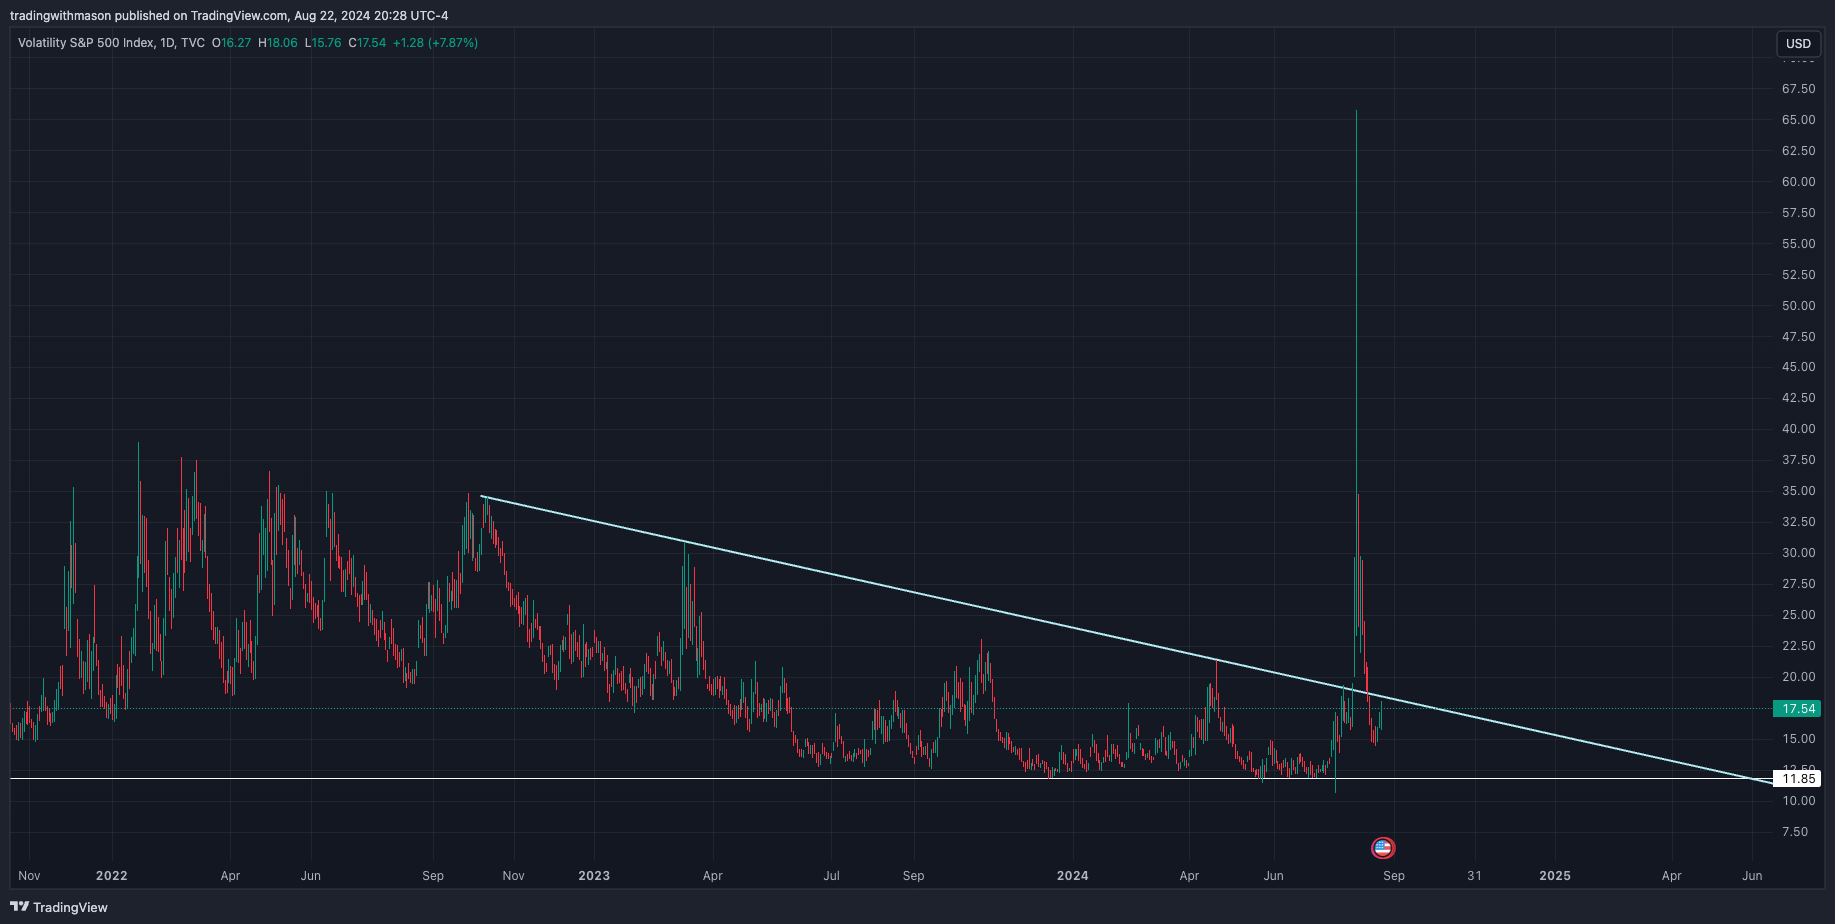
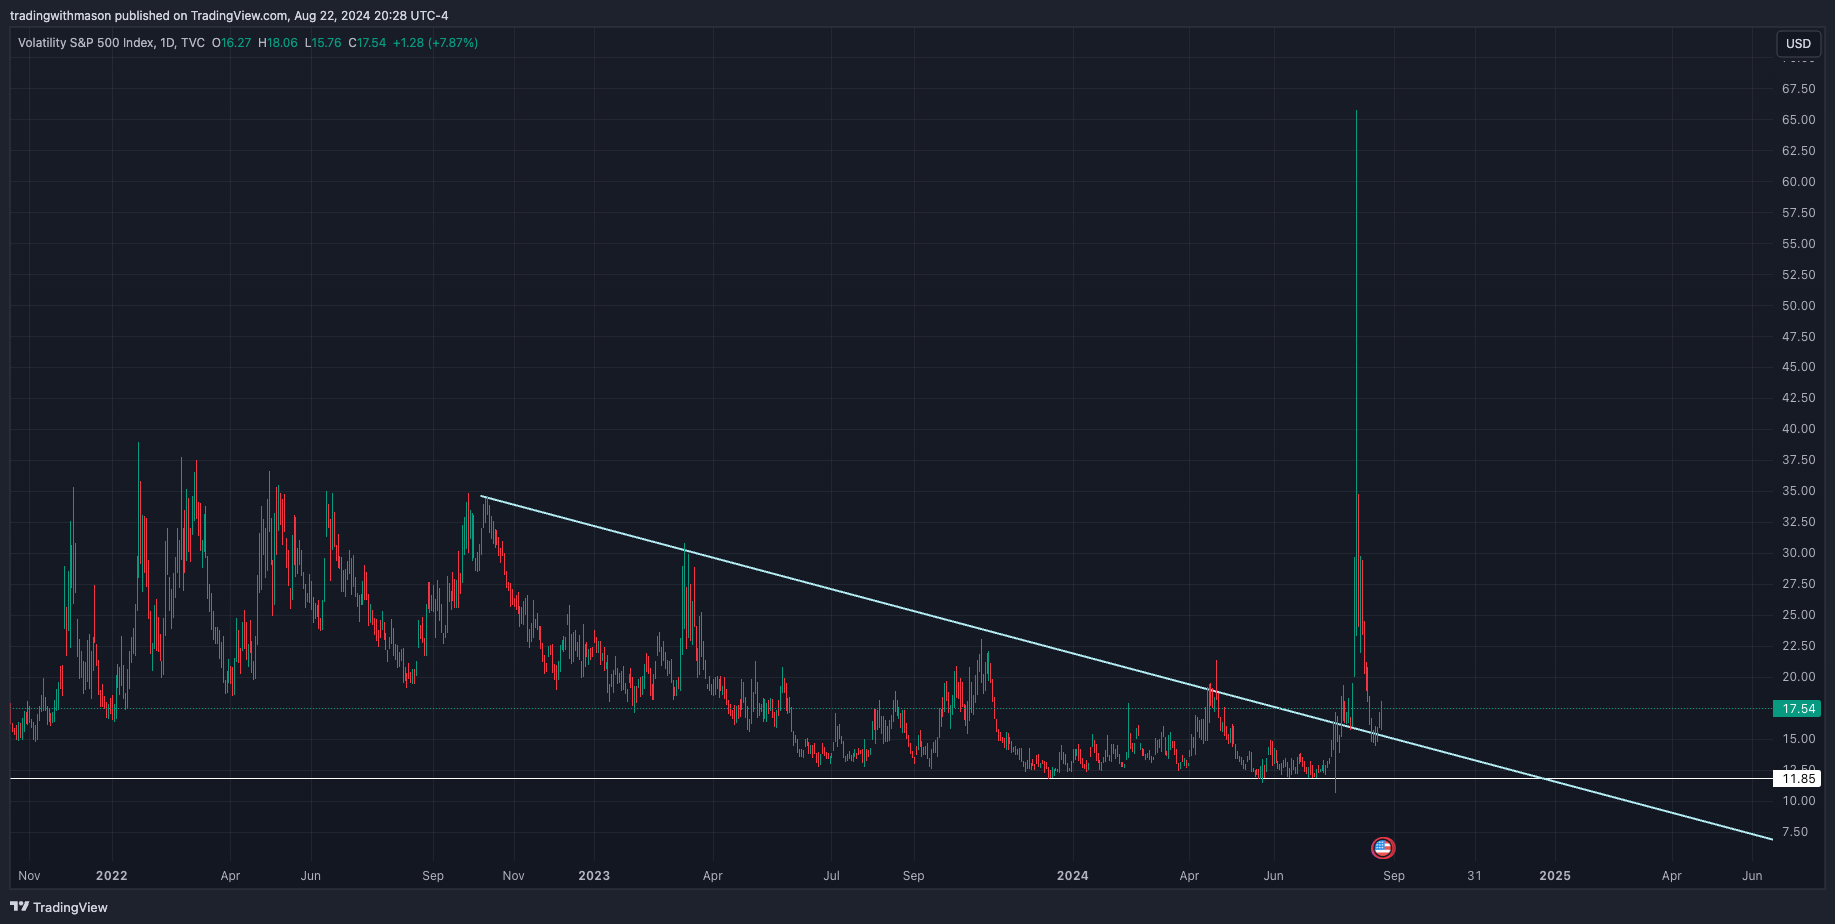
    Volatility picking back up

    Charting the VIX is difficult, so whether this drop was a retest of resistance or a recovery of support is yet to be seen. Here are two scenarios that are just as valid:

    If the first chart plays out, SPY should rally tomorrow, potentially to all-time highs. If the second chart ends up reflecting future price action, the selling has just begun.

    Jackson Hole: Bullish or bearish?

    The Jackson Hole symposium is tomorrow and hasn’t been followed by very much upside in the past. Of course, history doesn’t always repeat, but it’s definitely worth being aware of as we move into the election. In the last four years, the market has rallied on the day of the symposium but saw some substantial declines in the following days and weeks.

    If the market rallies tomorrow, I’ll add short shares again in NVDA and SPY next week.

  • Spy Range: 553 to 562

    SPY is currently between a support level of 553 and a resistance level of 562. Until there’s a breakout or breakdown, I won’t add any more short shares. This also applies to NVDA and KRE, which I mentioned in last night’s briefing.

    Rising wedge breakdown

    Above 562, there’s the top of the rising wedge pattern, but I’m not sure if it will still be valid after a three-day breakdown and subsequent recovery. I saw some posts that described that move as a false breakdown, but that’s not the case. False breakdowns don’t typically result in a 10% drop that is recovered in two weeks.

    Looking ahead

    That’s all for tonight. I recommend reading my posts from last week for more information on my positioning moving forward. I’m not convinced that the worst is over and am still expecting a significant sell-off and recession over the coming months or even years.